Effects of two familial hypertrophic cardiomyopathy mutations in alpha-tropomyosin, Asp175Asn and Glu180Gly, on the thermal unfolding of actin-bound tropomyosin
- PMID: 15454401
- PMCID: PMC1304903
- DOI: 10.1529/biophysj.104.048793
Effects of two familial hypertrophic cardiomyopathy mutations in alpha-tropomyosin, Asp175Asn and Glu180Gly, on the thermal unfolding of actin-bound tropomyosin
Abstract
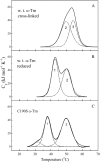
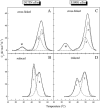
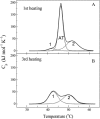
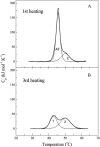
Differential scanning calorimetry was used to investigate the thermal unfolding of native alpha-tropomyosin (Tm), wild-type alpha-Tm expressed in Escherichia coli and the wild-type alpha-Tm carrying either of two missense mutations associated with familial hypertrophic cardiomyopathy, D175N or E180G. Recombinant alpha-Tm was expressed with an N-terminal Ala-Ser extension to substitute for the essential N-terminal acetylation of the native Tm. Native and Ala-Ser-Tm were indistinguishable in our assays. In the absence of F-actin, the thermal unfolding of Tm was reversible and the heat sorption curve of Tm with Cys-190 reduced was decomposed into two separate calorimetric domains with maxima at approximately 42 and 51 degrees C. In the presence of phalloidin-stabilized F-actin, a new cooperative transition appears at 46-47 degrees C and completely disappears after the irreversible denaturation of F-actin. A good correlation was found to exist between the maximum of this peak and the temperature of half-maximal dissociation of the F-actin/Tm complex as determined by light scattering experiments. We conclude that Tm thermal denaturation only occurs upon its dissociation from F-actin. In the presence of F-actin, D175N alpha-Tm shows a melting profile and temperature dependence of dissociation from F-actin similar to those for wild-type alpha-Tm. The actin-induced stabilization of E180G alpha-Tm is significantly less than for wild-type alpha-Tm and D175N alpha-Tm, and this property could contribute to the more severe myopathy phenotype reported for this mutation.
Figures


Similar articles
-
Effects of two hypertrophic cardiomyopathy mutations in alpha-tropomyosin, Asp175Asn and Glu180Gly, on Ca2+ regulation of thin filament motility.Biochem Biophys Res Commun. 1997 Jul 30;236(3):760-4. doi: 10.1006/bbrc.1997.7045. Biochem Biophys Res Commun. 1997. PMID: 9245729
-
Effects of two familial hypertrophic cardiomyopathy-causing mutations on alpha-tropomyosin structure and function.Biochemistry. 1997 Apr 15;36(15):4637-42. doi: 10.1021/bi962970y. Biochemistry. 1997. PMID: 9109674
-
Long-range effects of familial hypertrophic cardiomyopathy mutations E180G and D175N on the properties of tropomyosin.Biochemistry. 2012 Aug 14;51(32):6413-20. doi: 10.1021/bi3006835. Epub 2012 Aug 1. Biochemistry. 2012. PMID: 22794249 Free PMC article.
-
Vertebrate tropomyosin: distribution, properties and function.J Muscle Res Cell Motil. 2001;22(1):5-49. doi: 10.1023/a:1010303732441. J Muscle Res Cell Motil. 2001. PMID: 11563548 Review.
-
The role of tropomyosin in the regulation of myocardial contraction and relaxation.Pflugers Arch. 2003 Apr;446(1):1-8. doi: 10.1007/s00424-002-0900-3. Epub 2003 Feb 18. Pflugers Arch. 2003. PMID: 12690456 Review.
Cited by
-
Tropomyosin Isoforms Segregate into Distinct Clusters on Single Actin Filaments.Biomolecules. 2024 Sep 30;14(10):1240. doi: 10.3390/biom14101240. Biomolecules. 2024. PMID: 39456172 Free PMC article.
-
α-Tropomyosin with a D175N or E180G mutation in only one chain differs from tropomyosin with mutations in both chains.Biochemistry. 2012 Dec 11;51(49):9880-90. doi: 10.1021/bi301323n. Epub 2012 Nov 30. Biochemistry. 2012. PMID: 23170982 Free PMC article.
-
Novel Mutation Lys30Glu in the TPM1 Gene Leads to Pediatric Left Ventricular Non-Compaction and Dilated Cardiomyopathy via Impairment of Structural and Functional Properties of Cardiac Tropomyosin.Int J Mol Sci. 2024 Dec 5;25(23):13059. doi: 10.3390/ijms252313059. Int J Mol Sci. 2024. PMID: 39684770 Free PMC article.
-
Conserved Asp-137 is important for both structure and regulatory functions of cardiac α-tropomyosin (α-TM) in a novel transgenic mouse model expressing α-TM-D137L.J Biol Chem. 2013 Jun 7;288(23):16235-16246. doi: 10.1074/jbc.M113.458695. Epub 2013 Apr 22. J Biol Chem. 2013. PMID: 23609439 Free PMC article.
-
Conserved noncanonical residue Gly-126 confers instability to the middle part of the tropomyosin molecule.J Biol Chem. 2011 May 6;286(18):15766-72. doi: 10.1074/jbc.M110.209353. Epub 2011 Mar 14. J Biol Chem. 2011. PMID: 21454502 Free PMC article.
References
-
- Bing, W., C. S. Redwood, I. F. Purcell, G. Esposito, H. Watkins, and S. B. Marston. 1997. Effects of two hypertrophic cardiomyopathy mutations in alpha-tropomyosin, Asp175Asn and Glu180Gly, on Ca2+ regulation of thin filament motility. Biochem. Biophys. Res. Commun. 236:760–764. - PubMed
-
- Brandts, J. F., and L.-N. Lin. 1990. Study of strong to ultratight protein interactions using differential scanning calorimetry. Biochemistry. 29:6927–6940. - PubMed
-
- Freire, E., and R. L. Biltonen. 1978. Statistical mechanical deconvolution of thermal transitions in macromolecules. I. Theory and application to homogeneous systems. Biopolymers. 17:463–479.
-
- Golitsina, N. L., Y. An, N. J. Greenfield, L. Thierfelder, K. Iizuka, J. G. Seidman, C. E. Seidman, S. S. Lehrer, and S. E. Hitchcock-DeGregori. 1997. Effects of two familial hypertrophic cardiomyopathy-causing mutations on α-tropomyosin structure and function. Biochemistry. 36:4637–4642. (See also corrections to this article in Biochemistry. 1999. 38:3850.) - PubMed
Publication types
MeSH terms
Substances
LinkOut - more resources
Full Text Sources

