. 2004 Dec;87(6):4188-202.
doi: 10.1529/biophysj.104.051201. Epub 2004 Sep 28.

More than a monolayer: relating lung surfactant structure and mechanics to composition

Affiliations

More than a monolayer: relating lung surfactant structure and mechanics to composition

Coralie Alonso et al. Biophys J. 2004 Dec.

Abstract

Survanta, a clinically used bovine lung surfactant extract, in contact with surfactant in the subphase, shows a coexistence of discrete monolayer islands of solid phase coexisting with continuous multilayer "reservoirs" of fluid phase adjacent to the air-water interface. Exchange between the monolayer, the multilayer reservoir, and the subphase determines surfactant mechanical properties such as the monolayer collapse pressure and surface viscosity by regulating solid-fluid coexistence. Grazing incidence x-ray diffraction shows that the solid phase domains consist of two-dimensional crystals similar to those formed by mixtures of dipalmitoylphosphatidylcholine and palmitic acid. The condensed domains grow as the surface pressure is increased until they coalesce, trapping protrusions of liquid matrix. At approximately 40 mN/m, a plateau exists in the isotherm at which the solid phase fraction increases from approximately 60 to 90%, at which the surface viscosity diverges. The viscosity is driven by the percolation of the solid phase domains, which depends on the solid phase area fraction of the monolayer. The high viscosity may lead to high monolayer collapse pressures, help prevent atelectasis, and minimize the flow of lung surfactant out of the alveoli due to surface tension gradients.


Figures

FIGURE 1
FIGURE 1
Surface pressure-trough area (π-A) isotherms of Survanta adsorbed from saline suspension onto a saline buffer at 25°C. The first compression-expansion cycle is labeled 1. Consecutive compression-expansion cycles are labeled 24. The lower surface pressure at the beginning of the second cycle suggests that material is lost during the first compression. Dashed lines identify several zones common to all isotherms. Zone A is a homogeneous LE phase at low surface pressure. Zone B corresponds to phase coexistence between an LC phase and the LE phase (see Figs. 2–4). Zone C shows the squeeze-out plateau, starting at ∼38 mN/m, which accompanies the removal of the LE phases from the film, which leads to a less compressible condensed phase (zone D). At E, the film collapses; after the first cycle, the high surface pressure zones are reproducible, suggesting a minimal loss of solid phase.
FIGURE 2
FIGURE 2
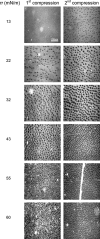
Fluorescence microscopy images of Survanta films spread on saline buffer at 37°C during the first (column 1) and second compression (column 2) of the films. The fluorescent lipid Texas Red-DHPE (0.5–1 mol%) (Molecular Probes) was added to provide contrast in the images. The solid phase (see Fig. 3 and Table 1) appears dark and the liquid phase is bright. The surface pressure (π) is given to the left. On the first compression, the film is in the liquid expanded phase at low surface pressures (13 mN/m). Increasing the surface pressure leads to a steady increase in the fraction of solid phase domains; the fluid phase remains continuous up to the plateau pressure. At 55 mN/m, above the plateau pressure, the number of bright, white spots increases, suggesting a loss of fluid phase material to the subphase. On the second compression, the film has changed sufficiently in composition that the solid phase domains start to nucleate by 13 mN/m (column 2). At every surface pressure, the fraction of solid phase is higher, consistent with the shift of the isotherms toward smaller areas in Fig. 1. The collapse of the film occurs through the formation of bright cracks, one of which is visible in the image at 55 mN/m. At high surface pressure, there is less evidence of bright spots in the image, consistent with less fluid phase being available.
FIGURE 3
FIGURE 3
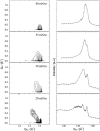
Contour plots (column 1) of the corrected x-ray intensities versus in-plane and out-of-plane scattering vector components Qxy and Qz for Survanta on water at 20°C. The corresponding Bragg peaks as function of Qxy are shown in column 2. The Bragg peaks were obtained by summarizing the measured x-ray intensities over Qz between 0 < Qz < 0.5 Å−1. From bottom to top the plots show the results obtained at 20, 30, 35, and 40 mN/m, respectively. At 20 mN/m, the contour plots show a significant intensity for Qz > 0, indicating a tilted phase. By 40 mN/m, the contour has moved to Qz = 0, indicating that the films are untitled. This shows that the solid phase is not pure DPPC, which remains tilted at 40 mN/m. The lattice parameters and phases are assigned in Table 1.
FIGURE 4
FIGURE 4
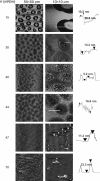
Atomic force microscopy images of Survanta transferred onto mica substrates by conventional Langmuir-Blodgett deposition at the surface pressure given at the left of each image. The low-resolution images are 25 × 25 μm, and the high-resolution images are 2.5- × 2.5-μm sections taken from the low-resolution images. The height trace in the third column corresponds to the white line on each high-resolution image. The brightness in the image increases with the height relative to the mica substrate. At 15 mN/m, the film consists of a continuous fluid phase separating circular domains of solid phase, consistent with the fluorescence images in Fig. 2. The fluid phase is ∼30 nm thicker than the solid phase domains, suggesting the adsorption of multilayers of lipid onto the fluid phase. At 30 mN/m, the morphology is similar, but the height difference has decreased and the solid domains appear less homogeneous and much rougher. As in the fluorescence images, the fraction of solid phase domains increases with increasing surface pressure. At 40 mN/m, the height difference between the solid and fluid domains decreases and the solid domains are packed closer together, although the fluid phase is still continuous. From 44–47 mN/m, the solid phase domains coalesce and the fluid phase is removed. At 44 mN/m, the solid and fluid phase both start to roughen, and the solid domains are no longer uniform circles; they appear to fuse to form more oblong structures. By 47 mN/m (see Fig. 7), most of the fluid phase has been removed; only small patches remain between the solid phase domains. Further compression to 70 mN/m does not change the monolayer significantly.
FIGURE 5
FIGURE 5
Relationship between the morphology of the solid domains in a Survanta film and isotherm features. AFM pictures were taken below (20 and 34 mN/m) and above (>40 mN/m) the plateau in the isotherm. The images were thresholded and the fractional area of the dark phase was determined to evaluate the solid phase fraction as a function of surface pressure (see Table 2 and Fig. 6). Below the plateau, the size of the solid domains (black areas) increases with the surface pressure. The plateau corresponds to the coalescence of these domains.
FIGURE 6
FIGURE 6
Solid area fraction (measured by AFM) and surface viscosity (η) plotted as a function of surface pressure. For low π the solid fraction area increases steadily and increases quickly at the plateau pressure, indicating the percolation of the solid domains and the expulsion of fluid phase from the interface (see Fig. 4). η increases exponentially (linear on this semilog plot) up to the plateau, then jumps by more than an order of magnitude at the plateau pressure. The viscosity transition is correlated with the large change in the solid fraction area and the jamming of the solid phase domains.
FIGURE 7
FIGURE 7
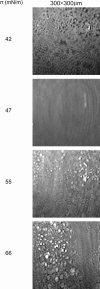
Brewster angle microscopy images of a Survanta film deposited on saline buffer at 25°C taken during the second compression. Each picture is 300 × 300 μm. The contrast is inverted from the fluorescence images—the solid phase is bright and the fluid phase is dark. At the plateau (Fig. 1, zone C) at 42 mN/m, the dark (fluid) phase is mainly eliminated in favor of the bright (solid) phase. The solid phase is beginning to coalesce, as in the fluorescence and AFM images. By 47 mN/m, the contrast is lost, indicative of a homogenous condensed monolayer. On further compression (zone D), bright white spots appear representing three-dimensional aggregates and their number increases up to the collapse pressure (66 mN/m).
FIGURE 8
FIGURE 8
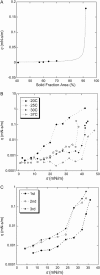
(A) Surface viscosity (η) plotted as a function of the solid fraction area, A, for a Survanta film deposited on saline buffer at 25°C. The dotted line is a fit to formula image with η0 = 0.0003 mN-s/m and Ac = 0.9 (Ding et al., 2002a). It was difficult to prepare films for AFM evaluation over the narrow range in surface pressure during which the solid phase fraction changed from 70 to 90% (see Table 2). (B) Surface shear viscosity (η) measured as a function of surface pressure (π) for a Survanta film deposited on saline buffer as a function of temperature for 20, 25, 30, and 37°C. The basic features of the surface viscosity response are the same at all temperatures. The surface pressure at which the viscosity transition occurs increases with increasing temperature, consistent with the shift of the plateau in the isotherm and the critical area fraction toward higher surface pressure with temperature. (C) Surface shear viscosity (η) of Survanta film at 25°C for three consecutive compression-expansion cycles. The viscosity transition occurs at a lower surface pressure for the second and third cycles, consistent with the differences in the isotherms in Fig. 1. The overall viscosity is higher as well. This is consistent with the loss fluid phase as shown in the isotherms in Fig. 1 and the images in Figs. 2 and 4.

Similar articles

Cited by

References

    1. Alonso, C., A. J. Waring, and J. Zasadzinski. 2004. Keeping lung surfactant where it belongs: protein regulation of two-dimensional viscosity. Biophys. J. In press. - PMC - PubMed
    1. Alonso, C., and J. Zasadzinski. 2004. Linear dependence of surface drag on surface viscosity. Phys. Rev. E. 69:021602. - PubMed
    1. Als-Nielsen, J., D. Jacquemain, K. Kjaer, L. Lahav, F. Leveiller, and L. Leiserowitz. 1994. Principles and applications of grazing incidence x-ray and neutron scattering from ordered molecular monolayers at the air-water interface. Phys. Rep. 246:251–313.
    1. Als-Nielsen, J., and H. Möhwald. 1991. Synchrotron X-ray Scattering Studies of Langmuir Films. S. Ebashi, M. Koch, and E. Rubinstein, editors. Elsevier, Amsterdam, The Netherlands.
    1. Bangham, A. D., C. J. Morley, and M. C. Phillips. 1979. The physical properties of an effective lung surfactant. Biochim. Biophys. Acta. 573:552–556. - PubMed

Publication types

LinkOut - more resources