Comparative Study
. 2004 Oct;87(4):2131-47.
doi: 10.1529/biophysj.104.039511.

Geometric and material determinants of patterning efficiency by dielectrophoresis

Collaborators, Affiliations
Comparative Study

Geometric and material determinants of patterning efficiency by dielectrophoresis

Dirk R Albrecht et al. Biophys J. 2004 Oct.

Abstract

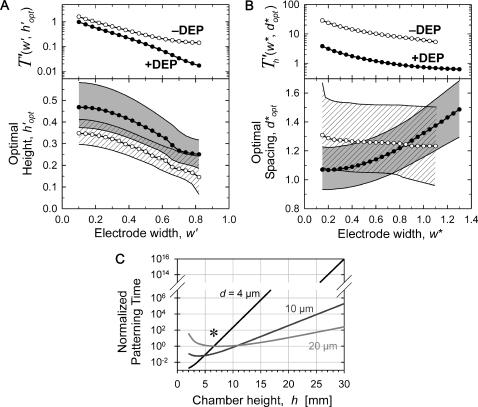
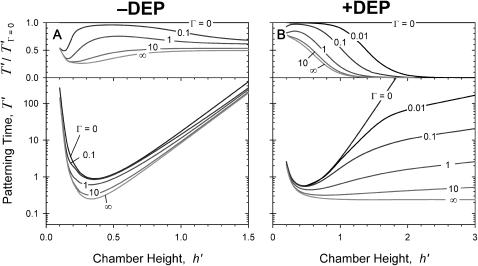
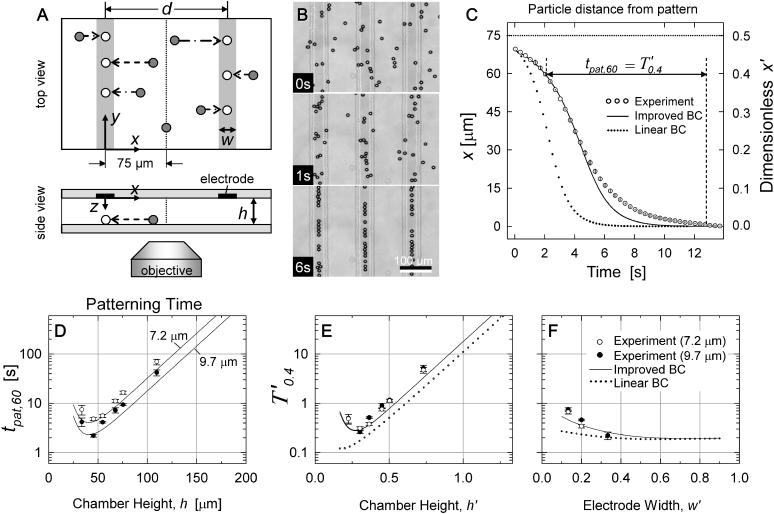
Dielectrophoretic (DEP) forces have been used extensively to manipulate, separate, and localize biological cells and bioparticles via high-gradient electric fields. However, minimization of DEP exposure time is desirable, because of possible untoward effects on cell behavior. Toward this goal, this article investigates the geometric and material determinants of particle patterning kinetics and efficiency. In particular, the time required to achieve a steady-state pattern is theoretically modeled and experimentally validated for a planar, interdigitated bar electrode array energized in a standing-wave configuration. This measure of patterning efficiency is calculated from an improved Fourier series solution of DEP force, in which realistic boundary conditions and a finite chamber height are imposed to reflect typical microfluidic applications. The chamber height, electrode spacing, and fluid viscosity and conductivity are parameters that profoundly affect patterning efficiency, and optimization can reduce electric field exposure by orders of magnitude. Modeling strategies are generalizable to arbitrary electrode design as well as to conditions where DEP force may not act alone to cause particle motion. This improved understanding of DEP patterning kinetics provides a framework for new advances in the development of DEP-based biological devices and assays with minimal perturbation of cell behavior.


Figures

FIGURE 1
FIGURE 1
(A) Schematic of the DEP patterning chamber with interdigitating bar electrodes (shaded) at bottom surface. Top and bottom surfaces (shaded) are nonconducting glass. Geometric variables include chamber height (h), electrode spacing (d), and electrode width (w). (B) The 2-D problem space for the numerical model, depicting volume dimensions and boundary conditions in the x-z plane. The rectangular liquid chamber containing water (ɛw = 80 ɛ0; σw = 10−4 S/m) is bounded at the top and bottom by glass (ɛgl = 4.5 ɛ0; σgl = 10−12 S/m; hgl = 1 mm). Potential is specified at the electrode surfaces (solid bars) only. (C) The simplified problem space used for the analytical solution. The boundary condition at the bottom plane is of Neumann type, where function f(x′) is determined from the FEM model (see text). (D) Neumann BC at z′ = 0. Normalized values from 13 FEM models spanning the geometry range of interest (points) are fit to a third-order polynomial f(x′) for analytical solution BC (shaded line). Electrode (solid bar) edge is at x′/w′ = 0.5.
FIGURE 2
FIGURE 2
Comparison of analytical solutions using the improved boundary condition (left, “Improved BC”) or a linear approximation between electrodes (right, “Linear BC”) and the numerical solution for w′ = 0.2. (A) Electric potential and field components at the electrode boundary, z′ = 0, demonstrate a closer match between the numerical model and the improved BC analytical model compared to the linear BC model. (B) Comparison between electric field magnitude from numerical solution formula image and analytical solutions |E′|, where contour shading indicates relative error: formula image The improved BC solution (left) deviates from the numerical solution by <3% for a majority of the solution space (dark red/orange), whereas the linear solution (right) deviates by >10% throughout most of the volume (white). Similar accuracy is achieved with models of different geometry.
FIGURE 3
FIGURE 3
Patterning motion and kinetics by (A) −DEP and (B) +DEP. (Right) The DEP patterning motion varies with initial particle location (formula image gray open circles), as indicated by centroid pathlines. Symbol points are equally spaced in time, indicating higher particle velocity near the electrode (solid bar). Near the pattern location (formula image black open circles), motion is slow by −DEP but rapid by +DEP. (Left) Contours of dimensionless patterning time formula image for various initial particle locations. This value is lowest near the pattern location and greatest at the opposite wall in between electrodes.
FIGURE 4
FIGURE 4
Effects of geometry on patterning efficiency by −DEP (A, C) and +DEP (B, D) for constant electrode spacing. Dimensionless complete patterning time, T′, varies with chamber height h′ and electrode width w′. Model calculations are presented as contour plots (log contours at 1, 2, 5 gradations) above (A, B) and as families of curves below (C, D) for particular electrode widths. To explain the chamber height effect, patterning kinetics (E) and electric field lines (F) are shown for three different chamber heights (a < b < c), where b represents the optimal height with fastest patterning for w′ = 0.4. Particle motion is tracked from x′ = 0.5 to the field minimum at x′ = 0. As chamber height increases beyond optimal (e.g., c), decreased electric field strength increases patterning time. However, at suboptimal chamber heights (a), patterning time increases dramatically due to confinement of the electric field nonuniformity near the electrode. Therefore, patterning is very slow in regions away from the electrodes (*), although it is very fast near the electrodes (**).
FIGURE 5
FIGURE 5
Effects of geometry on patterning efficiency by −DEP (A, C) and +DEP (B, D) for constant chamber height. The complete patterning time, nondimensionalized to chamber height, formula image, varies with electrode spacing d* = d/h and electrode width w* = w/h. Model calculations are presented as contour plots (log contours at 1, 2, 5 gradations) above (A, B) and as families of curves below (C, D) for particular electrode widths.
FIGURE 6
FIGURE 6
Optimal chamber geometry parameters for −DEP (○) and +DEP (•) determined by minimizing the complete patterning time T′ or formula image. (A) For a constant electrode spacing (d), the optimal chamber height (h′ = h/d) decreases as electrode width (w′ = w/d) increases. (B) Similarly, for a constant chamber height (h), the optimal electrode spacing (d* = d/h) varies with electrode width (w* = w/h). Shaded or hatched regions indicate parameters resulting in efficiency within 10% of optimal. Overall, patterning time decreases with wider electrodes (top panels). (C) An example of chamber height optimization for +DEP patterning of neutrally buoyant particles within a device containing three distinct electrode geometries: d = 4, 10, and 20 μm, w′ = 0.5. Most rapid patterning for all three geometries occurs at chamber height h ∼ 7 μm (*).
FIGURE 7
FIGURE 7
Effects of gravity on patterning efficiency by −DEP (A) and +DEP (B). Nondimensional complete patterning time is calculated for varying gravitational factor, Γ (defined in text), and chamber height. Electrode width is w′ = 0.2. Above, the relative patterning time compared to neutral buoyancy (Γ = 0) indicates that the potential for gravity to assist particle patterning is greater for +DEP than for −DEP.
FIGURE 8
FIGURE 8
(A) Schematic of video microscopy setup for validation of DEP patterning kinetics. Beads initially settle randomly (shaded circles). Application of AC voltage aligns beads (open circles) under the electrodes (solid and vertical shaded bars). Spacing between upper and lower glass slides (h) was adjusted between 34 and 110 μm. Electrode width varied from w = 20–50 μm, whereas electrode spacing was constant at d = 150 μm. Two bead diameters, 2R = 7.2 and 9.7 μm, were utilized. (B) Typical video images (h = 55 μm; w = 50 μm; 2R = 9.7 μm) of patterning beads at time t = 0, 1, and 6 s. Scale bar: 100 μm. (C) Typical patterning kinetics plotted as the distance away from the patterned location (mean ± SD, n ≥ 6) for h = 75 μm; w = 30 μm; 2R = 9.7 μm. (DF) Summary of validation experiments measuring tpat,60 (or T0.4), i.e., time for a bead to move from x = 60 μm (or x′ = 0.4) to 1 μm away from the pattern location, for w′ = 0.2. The improved analytical model (solid line) correctly predicts the optimal chamber height and the slower patterning kinetics at greater and smaller heights. Larger beads pattern faster (D; solid symbols and lower lines), and data points converge upon nondimensionalization (E). The improved BC solution results in closer prediction of patterning efficiency than the linear BC (dotted line). (F) Summary of validation experiments varying electrode width for height h = 55 μm and comparison to improved (solid line) and linear (dotted line) analytical models.

Similar articles

Cited by

References

    1. Abbott, A. 2003. Biology's new dimension. Nature. 424:870–872. - PubMed
    1. Albrecht, D. R., R. L. Sah, and S. N. Bhatia. 2002. Dielectrophoretic cell patterning within tissue engineering scaffolds. IEEE Proceedings of the Second Joint EMBS/BMES Conference 2:1708–1709.
    1. Archer, S., T. T. Li, A. T. Evans, S. T. Britland, and H. Morgan. 1999. Cell reactions to dielectrophoretic manipulation. Biochem. Biophys. Res. Commun. 257:687–698. - PubMed
    1. Arnold, W. M., and U. Zimmermann. 1988. Electro-rotation: development of a technique for dielectric measurements on individual cells and particles. Journal of Electrostatics. 21:151–191.
    1. Ashkin, A. 1997. Optical trapping and manipulation of neutral particles using lasers. Proc. Natl. Acad. Sci. USA. 94:4853–4860. - PMC - PubMed

MeSH terms

LinkOut - more resources