Comparative Study
. 2004 Oct;87(4):2172-86.
doi: 10.1529/biophysj.104.043000.

Uniform sampling of steady-state flux spaces: means to design experiments and to interpret enzymopathies

Affiliations
Comparative Study

Uniform sampling of steady-state flux spaces: means to design experiments and to interpret enzymopathies

Nathan D Price et al. Biophys J. 2004 Oct.

Abstract

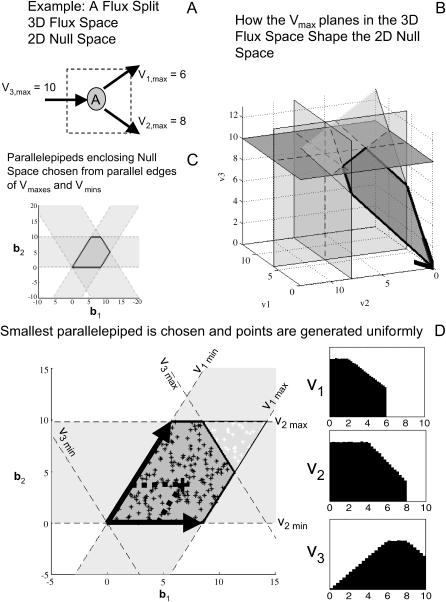
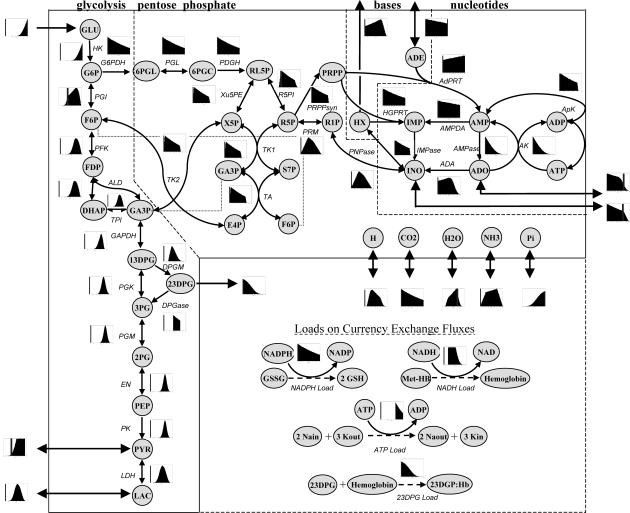
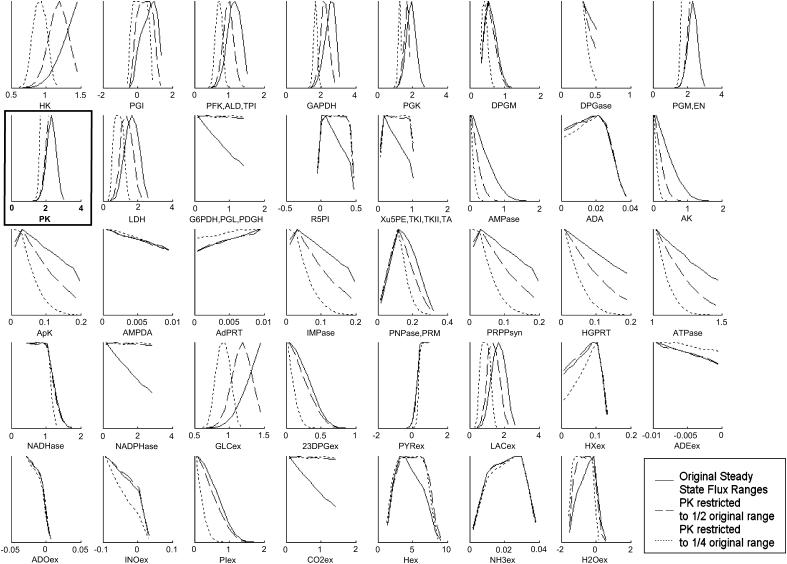
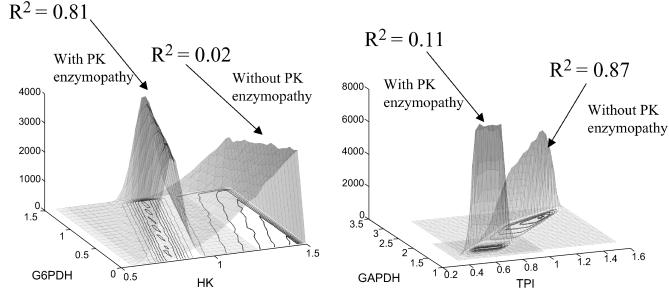
Reconstruction of genome-scale metabolic networks is now possible using multiple different data types. Constraint-based modeling is an approach to interrogate capabilities of reconstructed networks by constraining possible cellular behavior through the imposition of physicochemical laws. As a result, a steady-state flux space is defined that contains all possible functional states of the network. Uniform random sampling of the steady-state flux space allows for the unbiased appraisal of its contents. Monte Carlo sampling of the steady-state flux space of the reconstructed human red blood cell metabolic network under simulated physiologic conditions yielded the following key results: 1), probability distributions for the values of individual metabolic fluxes showed a wide variety of shapes that could not have been inferred without computation; 2), pairwise correlation coefficients were calculated between all fluxes, determining the level of independence between the measurement of any two fluxes, and identifying highly correlated reaction sets; and 3), the network-wide effects of the change in one (or a few) variables (i.e., a simulated enzymopathy or fixing a flux range based on measurements) were computed. Mathematical models provide the most compact and informative representation of a hypothesis of how a cell works. Thus, understanding model predictions clearly is vital to driving forward the iterative model-building procedure that is at the heart of systems biology. Taken together, the Monte Carlo sampling procedure provides a broadening of the constraint-based approach by allowing for the unbiased and detailed assessment of the impact of the applied physicochemical constraints on a reconstructed network.


Figures

FIGURE 1
FIGURE 1
Algorithm for boxing in solution space with parallelepiped and generating uniform random samples. A simple flux split was used as an example to demonstrate how the Monte Carlo sampling procedure works (A). The two-dimensional null space is constrained by the Vmax planes corresponding to the three reactions in the network (B). Once the null space is capped off by the reaction Vmax values, combinations choosing two of the three sets of parallel constraints leads to forming three potential parallelepipeds (C). The smallest of these parallelepipeds is chosen and uniform random points within the parallelepiped are generated (D) based on uniform weightings on the basis vectors defining the parallelepiped (shown as black arrows). Points within the solution space are kept and those that fall out of the solution space are discarded. The fraction of the points generated inside the parallelepiped that fall within the solution space is called the “hit fraction.” The hit fraction multiplied by the volume of the parallelepiped yields the volume of the solution space. Probability distributions for each of the three fluxes are calculated from the set of points within the solution space (D).
FIGURE 2
FIGURE 2
Probability flux distributions for human red blood cell. The red blood cell model with imposed maximum and minimum constraints on each flux was sampled using the in silico algorithm. The histograms next to each reaction represent the distribution of solutions with respect to each reaction flux. The vertical shaded line on each plot indicates where the zero flux line is. Several general flux distribution patterns have been identified including right peak (HK), left peak (G6PDH), central peak (PGK), and broad peak (PYR exchange). Due to the convexity of the solution space, no distribution can have more than one peak. The flux distribution shape gives information about the sensitivity of the solution space to each constraint. If a flux distribution has a right peak, decreasing a maximum constraint will eliminate many solutions from the valid space. Reactions that are part of the same pathway with no intermediate branch points (PGM, EM, PK) all have the same flux distributions. Distributions shown are based on 500,000 uniformly distributed points in the steady-state flux space. These details on these distributions can be seen in more detail in Fig. 3 (original distributions). The dotted lines in the load reactions represent the main physiologic function of the specified metabolic load, but are not explicitly accounted for in the stoichiometric matrix.
FIGURE 3
FIGURE 3
Systemic effects of simulated enzymopathy in pyruvate kinase. Pyruvate kinase catalyzes the reaction from PEP to pyruvate. Using the Monte Carlo sampling technique, the probability distribution of all fluxes in the red blood cell were shown (solid line). The allowable range of the PK reaction was decreased to 0.5 (dashed line) and 0.25 (dotted line) of its original range by decreasing its effective formula image. All of the curves were normalized such that the highest point in each of the curves is the same. The actual volume of the steady-state flux space being sampled and represented in each histogram is 6.8 × 10⁻⁵ (mM/h)11 for the original solution space, 2.1 × 10⁻⁵ (mM/h)11 (31% of original space) for PK range decreased in one-half, and 5.6 · 10−7 (mM/h)11 (0.83% of original solution space) for the PK range decreased to one-fourth. The effect of the simulated PK enzymopathy was different for different reactions, ranging from virtually no change (NH3 exchange) to significant shift in shape and magnitude (HK, PGK). Each distribution shown accounts for 100,000 uniformly distributed points within the steady-state flux space.
FIGURE 4
FIGURE 4
Effect of simulated enzymopathy on correlation between other fluxes in network. Decreasing the maximum reaction rate of PK decreases the number of valid steady-state solutions. Solutions for the simulated PK enzymopathy are a subset of those without the simulated PK enzymopathy. Thus, the areas under the curve as shown are not representative. In each case, the size of the solution space with the enzymopathy is 0.83% of the size of the solution space without the enzymopathy. The PK enzymopathy can increase or decrease the correlation between sets of reactions. The correlation between HK and G6PDH goes from 0.06 up to 0.85 when the range of PK values is reduced to 25% (A), whereas the correlation between TPI and GAPDH decreased from 0.83 to 0.07 (B). The plots were generated using 300,000 uniformly distributed points within the steady-state flux space.

References

    1. Almaas, E., B. Kovacs, T. Vicsek, Z. N. Oltvai, and A. L. Barabasi. 2004. Global organization of metabolic fluxes in the bacterium Escherichia coli. Nature. 427:839–843. - PubMed
    1. Alves, R., and M. A. Savageau. 2000a. Comparing systemic properties of ensembles of biological networks by graphical and statistical methods. Bioinformatics. 16:527–533. - PubMed
    1. Alves, R., and M. A. Savageau. 2000b. Extending the method of mathematically controlled comparison to include numerical comparisons. Bioinformatics. 16:786–798. - PubMed
    1. Alves, R., and M. A. Savageau. 2000c. Systemic properties of ensembles of metabolic networks: application of graphical and statistical methods to simple unbranched pathways. Bioinformatics. 16:534–547. - PubMed
    1. Bonarius, H. P. J., G. Schmid, and J. Tramper. 1997. Flux analysis of underdetermined metabolic networks: the quest for the missing constraints. Trends Biotechnol. 15:308–314.

Publication types