Comparative Study
. 2004 Oct;87(4):2271-82.
doi: 10.1529/biophysj.104.043091.

Asymmetry in membrane responses to electric shocks: insights from bidomain simulations

Affiliations
Comparative Study

Asymmetry in membrane responses to electric shocks: insights from bidomain simulations

Takashi Ashihara et al. Biophys J. 2004 Oct.

Abstract

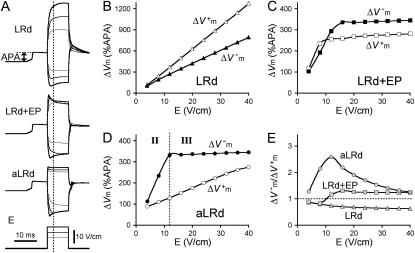
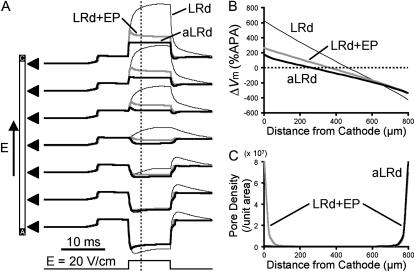
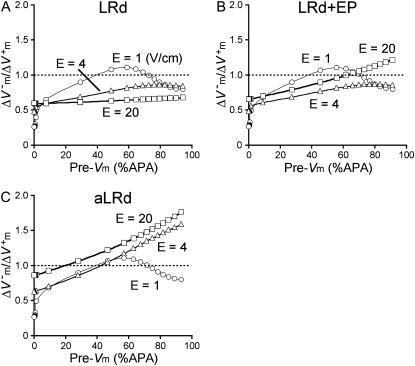
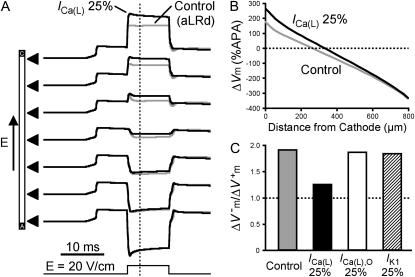
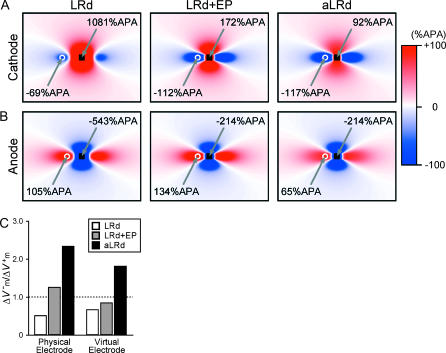
Models of myocardial membrane dynamics have not been able to reproduce the experimentally observed negative bias in the asymmetry of transmembrane potential changes (DeltaVm) induced by strong electric shocks delivered during the action potential plateau. The goal of this study is to determine what membrane model modifications can bridge this gap between simulation and experiment. We conducted simulations of shocks in bidomain fibers and sheets with membrane dynamics represented by the LRd'2000 model. We found that in the fiber, the negative bias in DeltaVm asymmetry could not be reproduced by addition of electroporation only, but by further addition of hypothetical outward current, Ia, activated upon strong shock-induced depolarization. Furthermore, the experimentally observed rectangularly shaped positive DeltaVm, negative-to-positive DeltaVm ratio (asymmetry ratio) = approximately 2, electroporation occurring at the anode only, and the increase in positive DeltaVm caused by L-type Ca2+-channel blockade were reproduced in the strand only if Ia was assumed to be a part of K+ flow through the L-type Ca2+-channel. In the sheet, Ia not only contributed to the negative bias in DeltaVm asymmetry at sites polarized by physical and virtual electrodes, but also restricted positive DeltaVm. Inclusion of Ia and electroporation is thus the bridge between experiment and simulation.


Figures

FIGURE 1
FIGURE 1
(A) Homogeneous bidomain myocardial fiber, representing the electrical behavior of the cultured myocyte strand in the direction of the applied electric field in the experiment (Gillis et al., 1996; Cheek et al., 2000; Fast et al., 2000; Fast and Cheek, 2002; Cheek and Fast, 2004). Characters C and A at fiber ends denote cathode and anode, respectively. (B) Homogeneous myocardial sheet. Shaded bars at the vertical borders indicate grounding electrodes, whereas the black square in the center of the sheet represents a unipolar shock electrode. The rectangle of size 1.5 × 1.125 cm outlined by the dotted line represents the portion of the sheet shown in Fig. 6.
FIGURE 2
FIGURE 2
Transmembrane potential responses to 10-ms shocks of various strengths, E, given at a coupling interval of 10 ms in an 800-μm long fiber. Membrane kinetics is represented by the original LRd, LRd with electroporation (LRd+EP), and the augmented LRd (aLRd) models. (A) Superposition of shock-induced positive and negative polarization at the ends of the fiber for the three models. Shock strengths are 8, 12, and 16 V/cm (thin, thicker, and thickest lines, respectively). APA is action potential amplitude. Vertical dotted line indicates 3 ms after shock onset, the time at which ΔVm is measured. (BD) formula image and formula image (%APA) as functions of shock strength in the LRd (B), LRd+EP (C), and aLRd (D) fibers. (E) Relationship between asymmetry ratio formula image and shock strength for the LRd, LRd+EP, and aLRd fibers as calculated from panels B, C, and D, respectively. Horizontal dotted line represents formula image
FIGURE 3
FIGURE 3
Spatial distribution of ΔVm and electroporation induced by 10-ms shocks of strength 20 V/cm in an 800-μm long fiber. (A) Traces of shock-induced polarization transients at seven recording sites along the fiber denoted by black triangles, for the LRd, LRd+EP, and aLRd cases (thin black, thick gray, and thick black traces, respectively). Shock pulse is shown at the bottom. (B) Spatial distribution of ΔVm (%APA) along the fiber 3 ms after shock onset, denoted as vertical dotted line in panel A, for the three different cases. (C) Spatial distribution of pore density resulting from electroporation at shock end along the LRd+EP and aLRd fibers.
FIGURE 4
FIGURE 4
Asymmetry ratio formula image as a function of preshock Vm (Pre-Vm) in units %APA for shock strengths of 1, 4, and 20 V/cm in the 3200-μm long fiber for the LRd (A), LRd+EP (B), and aLRd (C) cases.
FIGURE 5
FIGURE 5
Effect of ionic channel blockade on Vm responses to shocks of strength 20 V/cm in the 800-μm long fiber. (A) Shock-induced polarization transients at seven recording sites along the fiber identified by triangles for aLRd (control) and for aLRd with 75% reduction of ICa(L) (denoted as ICa(L) 25%) models. Shock pulse is shown at the bottom. (B) Spatial distribution of ΔVm (%APA) along the strand 3 ms after shock onset in the control aLRd case and in the case of ICa(L) 25%. (C) Asymmetry ratios 3 ms after shock onset in the cases of control, ICa(L) 25%, original LRd ICa(L) reduction by 75% (denoted as ICa(L),O 25%), and IK1 reduction by 75% (denoted as IK1 25%).
FIGURE 6
FIGURE 6
ΔVm maps after 10-ms cathodal (A) and anodal (B) shocks of strength 20 mA in the LRd, LRd+EP, and aLRd sheets. Each ΔVm map is normalized to APA. Only part of the sheet, the one outlined by the black dotted rectangle in Fig. 1 B, is shown. The black square represents the unipolar shock electrode. The white circle denotes the site of peak ΔVm magnitude in the virtual electrode. (C) Asymmetry ratios in the three cases at the centers of the black squares (physical electrodes) and the white circles (virtual electrodes) in panels A and B.

Similar articles

Cited by

References

    1. Aguel, F., K. A. Debruin, W. Krassowska, and N. A. Trayanova. 1999. Effects of electroporation on the transmembrane potential distribution in a two-dimensional bidomain model of cardiac tissue. J. Cardiovasc. Electrophysiol. 10:701–714. - PubMed
    1. Al-Khadra, A., V. Nikolski, and I. R. Efimov. 2000. The role of electroporation in defibrillation. Circ. Res. 87:797–804. - PubMed
    1. Ashihara, T., T. Namba, T. Ikeda, M. Ito, K. Nakazawa, and N. Trayanova. 2004a. Mechanisms of myocardial capture and temporal excitable gap during spiral wave reentry in a bidomain model. Circulation. 109:920–925. - PubMed
    1. Ashihara, T., T. Namba, M. Ito, T. Ikeda, K. Nakazawa, and N. Trayanova. 2004b. Spiral wave control by a localized stimulus: a bidomain model study. J. Cardiovasc. Electrophysiol. 15:226–233. - PubMed
    1. Ashihara, T., T. Namba, T. Yao, T. Ozawa, A. Kawase, T. Ikeda, K. Nakazawa, and M. Ito. 2003. Vortex cordis as a mechanism of postshock activation: arrhythmia induction study using a bidomain model. J. Cardiovasc. Electrophysiol. 14:295–302. - PubMed

LinkOut - more resources