Comparative Study
. 2004 Oct;87(4):2335-51.
doi: 10.1529/biophysj.104.044180.

A model of the putative pore region of the cardiac ryanodine receptor channel

Affiliations
Comparative Study

A model of the putative pore region of the cardiac ryanodine receptor channel

William Welch et al. Biophys J. 2004 Oct.

Abstract

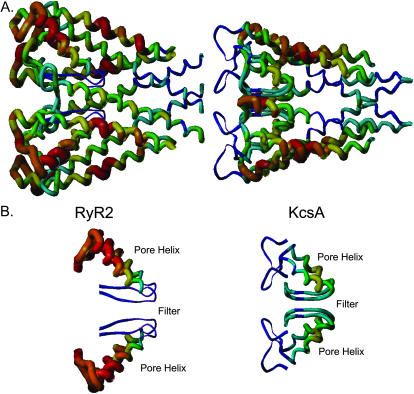
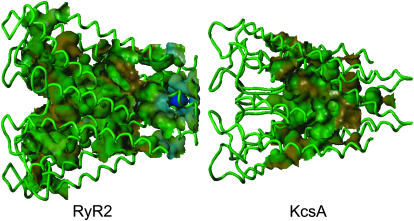
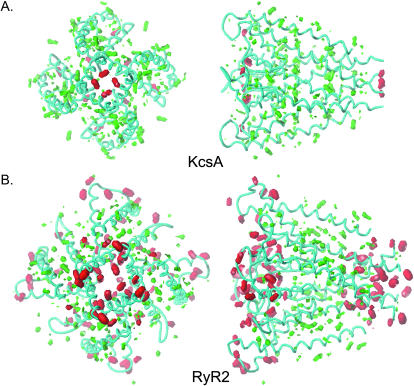
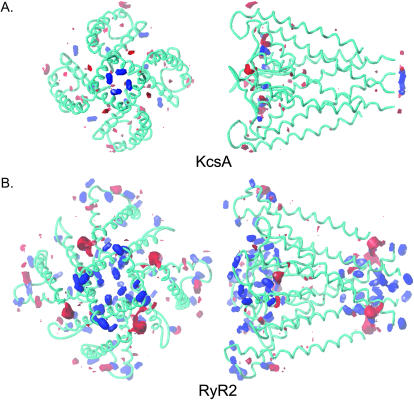
Using the bacterial K+ channel KcsA as a template, we constructed models of the pore region of the cardiac ryanodine receptor channel (RyR2) monomer and tetramer. Physicochemical characteristics of the RyR2 model monomer were compared with the template, including homology, predicted secondary structure, surface area, hydrophobicity, and electrostatic potential. Values were comparable with those of KcsA. Monomers of the RyR2 model were minimized and assembled into a tetramer that was, in turn, minimized. The assembled tetramer adopts a structure equivalent to that of KcsA with a central pore. Characteristics of the RyR2 model tetramer were compared with the KcsA template, including average empirical energy, strain energy, solvation free energy, solvent accessibility, and hydrophobic, polar, acid, and base moments. Again, values for the model and template were comparable. The pores of KcsA and RyR2 have a common motif with a hydrophobic channel that becomes polar at both entrances. Quantitative comparisons indicate that the assembled structure provides a plausible model for the pore of RyR2. Movement of Ca2+, K+, and tetraethylammonium (TEA+) through the model RyR2 pore were simulated with explicit solvation. These simulations suggest that the model RyR2 pore is permeable to Ca2+ and K+ with rates of translocation greater for K+. In contrast, simulations indicate that tetraethylammonium blocks movement of metal cations.


Figures

FIGURE 1
FIGURE 1
The primary sequences of (A) the bacterial K+ channel, KcsA, from Streptomyces lividans and (B) the rabbit type-2 ryanodine receptor, RyR2, included in this analysis. The regions identified as the outer helix, pore helix, selectivity filter, and inner helix of both sequences are highlighted by shaded boxes.
FIGURE 2
FIGURE 2
Schematic tube diagram of (A) the RyR2 model and (B) KcsA. The individual structural elements that comprise the pore-forming regions of these two structures have been colored as follows: outer helix (blue); pore helix (red); selectivity filter (green); and inner helix (cyan). For purposes of clarity, just two of the four monomers are shown.
FIGURE 3
FIGURE 3
(A) Statistical energy functions of the RyR2 model compared to KcsA. Colors represent the statistical energies at various positions along the peptide backbone: purple is the energetically most favorable, whereas red is the energetically least favorable. The width of the tubes conveys similar information: narrow regions are energetically favorable whereas wide regions are energetically less favorable. Both structures are orientated such that the cytosolic side is on the right. (B) The trajectories of the selectivity filters and pore helices of the two structures are shown in more detail. Color coding is as described for A.
FIGURE 4
FIGURE 4
(A) The solvation free energy of the RyR2 model compared to KcsA. The peptide backbone of the two structures has been colored so that purple represents the most negative solvation free energy (i.e., strongest solvation) and red the most positive (i.e., unfavorable hydration). Both structures are orientated such that the cytosolic side is on the right. (B) The trajectories of the selectivity filters and pore helices of the two structures are shown in more detail. Color coding is as described for A.
FIGURE 5
FIGURE 5
The water accessible areas (Connolly channel as implemented in SYBYL) of the RyR2 model compared to KcsA. The internal volume that can be occupied by water is colored green. Note that water can transverse the entire length of the predicted RyR2 pore, whereas it cannot get into the selectivity filter of KcsA (1BL8). Both structures are orientated such that the cytosolic side is on the right.
FIGURE 6
FIGURE 6
The hydrophobicity projected onto the water accessible surface of the RyR2 model compared to KcsA. Hydrophobicity of the pore-lining residues is symbolized as colors: (brown) the most hydrophobic, (green) borderline hydrophobic, and (blue) the most polar. Both structures are orientated such that the cytosolic side is on the right.
FIGURE 7
FIGURE 7
The electrostatic potential projected onto the water accessible surface of the RyR2 model compared to KcsA. Electrostatic potential is symbolized as colors: (blue) the most negative potential and (red) the most positive. Both structures are orientated such that the cytosolic side is on the right.
FIGURE 8
FIGURE 8
The hydrophobic and polar moments of the RyR2 model compared to KcsA (HINT as implemented in SYBYL). In both cases the peptide backbone is shown in cyan. Both KcsA and RyR2 are contoured at the same potentials (red: polar, contoured at −56; and green: hydrophobic, contoured at +28). The volumes enclosed are proportional to the value of property. The left-hand panels of A and B are orientated such that the structures are viewed from the cytosol. In the right-hand panels, the cytosolic ends of the structures are on the right. Both RyR2 and KcsA are on the same scale so that volumes can be compared directly.
FIGURE 9
FIGURE 9
The acid/base potential of the RyR2 model compared to KcsA (HINT as implemented in SYBYL). In both structures, the contours demonstrate the condition of amino acid residues at pH 7.0. Conjugate acids under these conditions, such as Lys and Arg, are contoured red (at −18), and conjugate bases, such as Glu and Asp are contoured blue (at +56). Acids and bases were calculated using the Lewis acid definition to give the most general description of the properties of KcsA and RyR2. At pH 7.0 the carboxylates will be Lewis bases because they are capable of donating electrons to a proton (a Lewis acid). The Lewis acid/base contours also describe the tendency of the groups to form interactions with metal ions. The volumes enclosed are proportional to the value of the property. The left-hand panels of A and B are orientated such that the structures are viewed from the cytosol. In the right-hand panels, the cytosolic ends of the structures are on the right. Both RyR2 and KcsA are contoured on the same scale so that volumes can be compared directly.
FIGURE 10
FIGURE 10
Molecular dynamics simulation of a single K+ ion as it is pulled though the KcsA pore in the presence of explicit solvation and 12 bystander K+ ions. Kinetically important residues (located within 3 Å of the K+ ion during the dips in velocity shown in B) are illustrated as space fill amino acid residues. Velocity profiles, such as that in B, identify the most significant kinetic barriers at (from left to right, cytosol to extracellular) Glu-118, Gly-116, Thr-112, Ala-111, Thr-74, Thr-75, Gly-77, Try-78, and Gly-79. See text for further details.
FIGURE 11
FIGURE 11
Molecular dynamics simulation of a single K+ ion as it is pulled though the RyR2 pore in the presence of explicit solvation and 12 bystander K+ ions. Kinetically important residues (located within 3 Å of the K+ ion during the dips in velocity shown in B) are illustrated as space fill amino acid residues. Velocity profiles, such as that in B, identify the most significant kinetic barriers (from left to right, cytosol to lumen) at Gln-4881, Glu-4880, Asp-4877, Gly-4873, Ile-4869, Gly-4827, Glu-4832, and Ala-4837. See text for further details.

References

    1. Anyatonwu, G. I., E. D. Buck, and B. E. Ehrlich. 2003. Methanethiosulfonate ethylammonium block of amine currents through the ryanodine receptor reveals single pore architecture. J. Biol. Chem. 278:45528–45538. - PubMed
    1. Balshaw, D., L. Gao, and G. Meissner. 1999. Luminal loop of the ryanodine receptor: a pore-forming segment? Proc. Natl. Acad. Sci. USA. 96:3345–3347. - PMC - PubMed
    1. Berridge, M. J., M. D. Bootman, and H. L. Roderick. 2003. Calcium signalling: dynamics, homeostasis and remodelling. Nat. Rev. Mol. Cell Biol. 4:517–529. - PubMed
    1. Dayhoff, M. O., R. M. Schwartz, and B. C. Orcutt. 1978. A model of evolutionary change in proteins. In Atlas of Protein Sequence and Structure. M. O. Dayhoff, editor. National Biomedical Research Foundation, Silver Spring, MD. 345–52.
    1. Doyle, D. A., J. M. Cabral, R. A. Pfuetzner, A. L. Kuo, J. M. Gulbis, S. L. Cohen, B. T. Chait, and R. MacKinnon. 1998. The structure of the potassium channel: molecular basis of K+ conduction and selectivity. Science. 280:69–77. - PubMed

Publication types