Comparative Study
. 2004 Oct;87(4):2749-58.
doi: 10.1529/biophysj.104.042234.

Using single-particle tracking to study nuclear trafficking of viral genes

Affiliations
Comparative Study

Using single-particle tracking to study nuclear trafficking of viral genes

Hazen P Babcock et al. Biophys J. 2004 Oct.

Abstract

The question of how genetic materials are trafficked in and out of the cell nucleus is a problem of great importance not only for understanding viral infections but also for advancing gene-delivery technology. Here we demonstrate a physical technique that allows gene trafficking to be studied at the single-gene level by combining sensitive fluorescence microscopy with microinjection. As a model system, we investigate the nuclear import of influenza genes, in the form of ribonucleoproteins (vRNPs), by imaging single vRNPs in living cells in real time. Our single-particle trajectories show that vRNPs are transported to the nuclear envelope by diffusion. We have observed heterogeneous interactions between the vRNPs and nuclear pore complexes with dissociation rate constants spanning two orders of magnitude. Our single-particle tracking experiments also provided new insights into the regulation mechanisms for the nuclear import of vRNPs: the influenza M1 protein, a regulatory protein for the import process, downregulates the nuclear import of vRNPs by inhibiting the interactions between vRNPs and nuclear pore complexes but has no significant effect on the transport properties of vRNPs. We expect this single-particle tracking approach to find broad application in investigations of genetic trafficking.


Figures

FIGURE 1
FIGURE 1
Nuclear import of dye-labeled vRNP. (A) A DIC image of an injected cell. (B) A fluorescence image of the same cell, taken 30 min after vRNP injection, showing nuclear import of the labeled vRNPs. Scale bars: 10 μm. (C) Nuclear import kinetics of labeled and unlabeled vRNPs. The amount of vRNPs in the cytoplasm and nucleus were quantified using Cy3 fluorescence and antinucleoprotein immunofluorescence for the labeled and unlabeled vRNPs, respectively. Fin and Fout indicate, respectively, the average fluorescence intensities inside and outside the nucleus after subtraction of a background term determined from areas outside the injected cells. The t = 0 point indicates the time of injection. The value of Fin/(Fin + Fout) at t = 0 was determined by coinjecting WGA (5mg/ml) with labeled vRNP to block import. This value is not zero because vRNPs that are outside but directly above or below the nucleus contribute to Fin.
FIGURE 2
FIGURE 2
Tracking the movement of single vRNPs. (A) A DIC image of part of a cell with the trajectories of two example vRNP particles overlaid as black lines. Scale bar: 10 μm. (B) The measured mean-square displacement (〈Δr2〉) versus time (Δt) for four example vRNPs in the cytoplasm of a cell. Lines are the best fit to 〈Δr2〉 = 4DΔt, with D being the diffusion coefficient. (C) 〈Δr2〉 versus Δt for four example vRNPs in the nucleus of a cell. The vRNP trajectories were determined 15 min after injection; this allowed the majority of the vRNPs to import into the nucleus. (D) The average mean-square displacement for all the vRNP in the cytoplasm (□) or in the nucleus (○). The cytoplasm data include 108 vRNP trajectories from six different cells, and the nucleus data include 37 vRNP trajectories from six different cells. The average trajectory was 113 frames long in the cytoplasm and 54 frames long in the nucleus.
FIGURE 3
FIGURE 3
Analysis of the motion of single vRNPs. (A) The velocity autocorrelation of all the trajectories of vRNP in the cell cytoplasm (108 total). The autocorrelation was calculated using the formulaformula imagewhere n is the number of trajectories, tk(k = 1, 2,…, n) are the maximal time in each trajectory minus τ, with t and τ both in the unit of frames. (B) The velocity autocorrelation of all trajectories in the cell nucleus (37 total). (C) The shaded columns indicate a histogram of the measured diffusion coefficients of individual vRNP particles in the cytoplasm normalized so that the total area under the curve is 1. The diffusion coefficient, D, was determined using the relation 〈Δr2〉 = 4DΔt for each individual vRNP trajectory. The number of trajectories used is 108. The solid line with circles is a simulated distribution of diffusion coefficients calculated from 1000 simulated vRNP trajectories. The simulated trajectories were generated using the average diffusion coefficient determined from experiments. The length of the simulated trajectories was randomly chosen from a range that mimics the experimental trajectory lengths (see Material and Methods). (D) The experimental and simulated distribution of diffusion coefficients for vRNPs in the nucleus. The total number of experimental and simulated trajectories is 37 and 1000, respectively.
FIGURE 4
FIGURE 4
The interaction of the vRNP with the nuclear envelope. (A) A fluorescence image of a cell taken 2 min after injection of labeled vRNP. The ring at the nuclear envelope indicates association of vRNPs with the nuclear envelope. (B) A fluorescence image of a cell that was coinjected with labeled vRNP and anti-NPC (RL1). (C) A fluorescence image of a cell that was coinjected with labeled vRNP and WGA. (D) Same as A but with a lower concentration of labeled vRNP to allow the detection of individual vRNP particles. The gray line indicates the location of the nuclear envelope, determined using DIC microscopy. The image was convolved with a Gaussian filter to reduce noise. Scale bars: 10 μm.
FIGURE 5
FIGURE 5
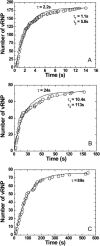
Integrated time histograms of the duration of binding events of individual vRNPs to the nuclear envelope. (A) The number of vRNP binding events with disassociation times shorter than the time indicated on the horizontal axis. The binding times were determined from movies taken at 10 fps (0.1-s time resolution) on 13 cells. The solid line is the best-fit single exponential decay with a time constant τ = 2.2 s and the shaded line is the best-fit double exponential decay with two time constants τ1 = 1.1 s and τ2 = 5.8 s. The second time constant is probably shorter than the actual dissociation time constant due to the finite observation window (20 s). (B) Integrated time histograms of the binding events of vRNPs to the nuclear envelope determined from movies taken at 1 fps (1-s time resolution) on six cells. The solid line is the best-fit single exponential decay (τ = 24 s), and the shaded line is the best-fit double exponential decay (τ1 = 10.4 s and τ2 = 113 s). Again the second time constant is probably not accurately determined due to the finite observation window (200 s). (C) Integrated time histograms of the binding events determined from movies taken at 0.2 fps (5-s time resolution) on eight cells. The solid line is the best-fit single exponential decay (τ = 89 s). These three experiments combined suggest the presence of three dissociation time constants, 1 s, 10 s, and 89 s.
FIGURE 6
FIGURE 6
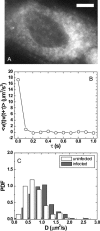
vRNP transport and vRNP-NPC interaction during the late stage of infection. (A) A fluorescence image of a cell taken 10 min after injection with labeled vRNPs. The cell was infected with influenza viruses 6 h before injection. No fluorescent ring is observed at the nuclear envelope in contrast to Fig. 3 A. (B) The velocity autocorrelation of all the vRNP trajectories in the cytoplasm of preinfected cells (163 trajectories and 17 cells). (C) The distribution of diffusion coefficients, D, in the cytoplasm of infected cells (gray) compared to that of uninfected cells (white).

References

    1. Bui, M., G. Whittaker, and A. Helenius. 1996. Effect of M1 protein and low pH on nuclear transport of influenza virus ribonucleoproteins. J. Virol. 70:8391–8401. - PMC - PubMed
    1. Bui, M., E. G. Wills, A. Helenius, and G. Whittaker. 2000. Role of the influenza virus M1 protein in nuclear export of viral ribonucleoproteins. J. Virol. 74:1781–1786. - PMC - PubMed
    1. Bullido, R., P. Gomez-Puertas, C. Albo, and A. Portela. 2000. Several protein regions contribute to determine the nuclear and cytoplasmic localization of the influenza A virus nucleoprotein. J. Gen. Virol. 81:135–142. - PubMed
    1. Byassee, T. A., W. C. Chan, and S. Nie. 2000. Probing single molecules in living cells. Anal. Chem. 72:5606–5611. - PubMed
    1. Compans, R. W., J. Content, and P. H. Duesberg. 1972. Structure of the ribonucleoprotein of influenza virus. J. Virol. 10:795–800. - PMC - PubMed

Publication types

MeSH terms

Substances