

A fast global fitting algorithm for fluorescence lifetime imaging microscopy based on image segmentation
- PMID: 15454472
- PMCID: PMC1304699
- DOI: 10.1529/biophysj.104.045492
A fast global fitting algorithm for fluorescence lifetime imaging microscopy based on image segmentation
Abstract
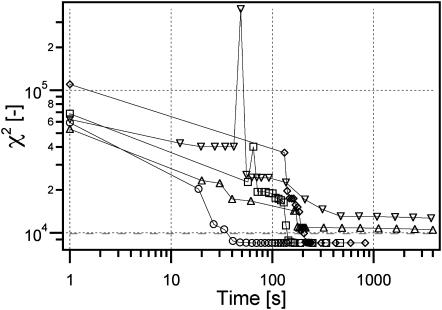
Global fitting algorithms have been shown to improve effectively the accuracy and precision of the analysis of fluorescence lifetime imaging microscopy data. Global analysis performs better than unconstrained data fitting when prior information exists, such as the spatial invariance of the lifetimes of individual fluorescent species. The highly coupled nature of global analysis often results in a significantly slower convergence of the data fitting algorithm as compared with unconstrained analysis. Convergence speed can be greatly accelerated by providing appropriate initial guesses. Realizing that the image morphology often correlates with fluorophore distribution, a global fitting algorithm has been developed to assign initial guesses throughout an image based on a segmentation analysis. This algorithm was tested on both simulated data sets and time-domain lifetime measurements. We have successfully measured fluorophore distribution in fibroblasts stained with Hoechst and calcein. This method further allows second harmonic generation from collagen and elastin autofluorescence to be differentiated in fluorescence lifetime imaging microscopy images of ex vivo human skin. On our experimental measurement, this algorithm increased convergence speed by over two orders of magnitude and achieved significantly better fits.
Copyright 2004 Biophysical Society
Figures


Similar articles
-
Fully linear reconstruction method for fluorescence yield and lifetime through inverse complex-source formulation: simulation studies.Opt Lett. 2010 Jun 1;35(11):1899-901. doi: 10.1364/OL.35.001899. Opt Lett. 2010. PMID: 20517455 Free PMC article.
-
Fluorescence-lifetime-based tomography for turbid media.Opt Lett. 2005 Dec 15;30(24):3347-9. doi: 10.1364/ol.30.003347. Opt Lett. 2005. PMID: 16389827
-
Image restoration for fluorescence lifetime imaging microscopy (FLIM).Opt Express. 2008 Nov 10;16(23):19192-200. doi: 10.1364/oe.16.019192. Opt Express. 2008. PMID: 19582011
-
A method to unmix multiple fluorophores in microscopy images with minimal a priori information.Opt Express. 2009 Dec 7;17(25):22747-60. doi: 10.1364/OE.17.022747. Opt Express. 2009. PMID: 20052200
-
Deconvolution of fluorescence lifetime imaging microscopy by a library of exponentials.Opt Express. 2015 Sep 7;23(18):23748-67. doi: 10.1364/OE.23.023748. Opt Express. 2015. PMID: 26368470 Free PMC article.
Cited by
-
Methodological considerations for global analysis of cellular FLIM/FRET measurements.J Biomed Opt. 2012 Feb;17(2):026013. doi: 10.1117/1.JBO.17.2.026013. J Biomed Opt. 2012. PMID: 22463045 Free PMC article.
-
The phasor approach to fluorescence lifetime imaging analysis.Biophys J. 2008 Jan 15;94(2):L14-6. doi: 10.1529/biophysj.107.120154. Epub 2007 Nov 2. Biophys J. 2008. PMID: 17981902 Free PMC article.
-
Fluorescence lifetime imaging microscopy: fundamentals and advances in instrumentation, analysis, and applications.J Biomed Opt. 2020 May;25(7):1-43. doi: 10.1117/1.JBO.25.7.071203. J Biomed Opt. 2020. PMID: 32406215 Free PMC article. Review.
-
Toward measurements of absolute membrane potential in Bacillus subtilis using fluorescence lifetime.Biophys Rep (N Y). 2025 Mar 12;5(1):100196. doi: 10.1016/j.bpr.2025.100196. Epub 2025 Jan 10. Biophys Rep (N Y). 2025. PMID: 39798601 Free PMC article.
-
Quantitative FRET analysis by fast acquisition time domain FLIM at high spatial resolution in living cells.Biophys J. 2008 Sep 15;95(6):2976-88. doi: 10.1529/biophysj.108.131276. Epub 2008 Jun 6. Biophys J. 2008. PMID: 18539634 Free PMC article.
References
-
- Agronskaia, A. V., L. Tertoolen, and H. C. Gerristen. 2003. High frame rate fluorescent lifetime imaging. J. Phys. D: Appl. Phys. 36:1655–1662.
-
- Apanasovich, V. V., and E. G. Novikov. 1990. Deconvolution method for fluorescence decays. Opt. Commun. 78:279–282.
-
- Apanasovich, V. V., and E. G. Novikov. 1996. The method of fluorescence decays simultaneous analysis. Rev. Sci. Instrum. 67:48–54.
-
- Ballew, R. M., and J. N. Demas. 1989. An error analysis of the rapid lifetime determination method for the evaluation of single exponential decays. Anal., Chem. 61:30–33. - PubMed
-
- Bascskai, B. J., J. Skoch, G. A. Hickey, R. Allen, and B. T. Hyman. 2003. Fluorescence resonance energy transfer determinations using multiphoton fluorescence lifetime imaging microscopy to characterize amyloid-beta plaques. J. Biomed. Opt. 8:368–375. - PubMed
Publication types
MeSH terms
Substances
Grants and funding
LinkOut - more resources
Full Text Sources
Other Literature Sources
