

Simultaneous estimation of haplotype frequencies and quantitative trait parameters: applications to the test of association between phenotype and diplotype configuration
- PMID: 15454562
- PMCID: PMC1448120
- DOI: 10.1534/genetics.104.029751
Simultaneous estimation of haplotype frequencies and quantitative trait parameters: applications to the test of association between phenotype and diplotype configuration
Abstract
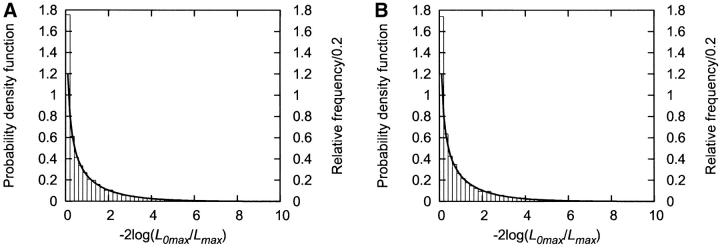
The analysis of the haplotype-phenotype relationship has become more and more important. We have developed an algorithm, using individual genotypes at linked loci as well as their quantitative phenotypes, to estimate the parameters of the distribution of the phenotypes for subjects with and without a particular haplotype by an expectation-maximization (EM) algorithm. We assumed that the phenotype for a diplotype configuration follows a normal distribution. The algorithm simultaneously calculates the maximum likelihood (L0max) under the null hypothesis (i.e., nonassociation between the haplotype and phenotype), and the maximum likelihood (Lmax) under the alternative hypothesis (i.e., association between the haplotype and phenotype). Then we tested the association between the haplotype and the phenotype using a test statistic, -2 log(L0max/Lmax). The above algorithm along with some extensions for different modes of inheritance was implemented as a computer program, QTLHAPLO. Simulation studies using single-nucleotide polymorphism (SNP) genotypes have clarified that the estimation was very accurate when the linkage disequilibrium between linked loci was rather high. Empirical power using the simulated data was high enough. We applied QTLHAPLO for the analysis of the real data of the genotypes at the calpain 10 gene obtained from diabetic and control subjects in various laboratories.
Figures

Similar articles
-
Association test algorithm between a qualitative phenotype and a haplotype or haplotype set using simultaneous estimation of haplotype frequencies, diplotype configurations and diplotype-based penetrances.Genetics. 2004 Dec;168(4):2339-48. doi: 10.1534/genetics.103.024653. Genetics. 2004. PMID: 15611197 Free PMC article.
-
Test of association between haplotypes and phenotypes in case-control studies: examination of validity of the application of an algorithm for samples from cohort or clinical trials to case-control samples using simulated and real data.Genetics. 2006 Nov;174(3):1505-16. doi: 10.1534/genetics.105.054452. Epub 2006 Sep 15. Genetics. 2006. PMID: 16980401 Free PMC article.
-
HAPLORE: a program for haplotype reconstruction in general pedigrees without recombination.Bioinformatics. 2005 Jan 1;21(1):90-103. doi: 10.1093/bioinformatics/bth388. Epub 2004 Jul 1. Bioinformatics. 2005. PMID: 15231536
-
Maximum-likelihood estimation of haplotype frequencies in nuclear families.Genet Epidemiol. 2004 Jul;27(1):21-32. doi: 10.1002/gepi.10323. Genet Epidemiol. 2004. PMID: 15185400
-
Fine mapping functional sites or regions from case-control data using haplotypes of multiple linked SNPs.Ann Hum Genet. 2005 Jan;69(Pt 1):102-12. doi: 10.1046/j.1529-8817.2004.00140.x. Ann Hum Genet. 2005. PMID: 15638831
Cited by
-
Influence of CYP2B6 polymorphisms on the persistence of plasma nevirapine concentrations following a single intra-partum dose for the prevention of mother to child transmission in HIV-infected Thai women.J Antimicrob Chemother. 2009 Dec;64(6):1265-73. doi: 10.1093/jac/dkp351. Epub 2009 Oct 6. J Antimicrob Chemother. 2009. PMID: 19812066 Free PMC article. Clinical Trial.
-
Estimation of haplotype associated with several quantitative phenotypes based on maximization of area under a receiver operating characteristic (ROC) curve.J Hum Genet. 2006;51(4):314-325. doi: 10.1007/s10038-006-0363-z. Epub 2006 Feb 15. J Hum Genet. 2006. PMID: 16479317
-
Haplotype associations with quantitative traits in the presence of complex multilocus and heterogeneous effects.Genet Epidemiol. 2009 Jan;33(1):63-78. doi: 10.1002/gepi.20358. Genet Epidemiol. 2009. PMID: 18636529 Free PMC article.
-
Improvement of mapping accuracy by unifying linkage and association analysis.Genetics. 2006 Jan;172(1):647-61. doi: 10.1534/genetics.105.045781. Epub 2005 Sep 19. Genetics. 2006. PMID: 16172505 Free PMC article.
-
Contrasting linkage-disequilibrium patterns between cases and controls as a novel association-mapping method.Am J Hum Genet. 2006 May;78(5):737-746. doi: 10.1086/503710. Epub 2006 Mar 13. Am J Hum Genet. 2006. PMID: 16642430 Free PMC article.
References
-
- Bader, J. S., 2001. The relative power of SNPs and haplotype as genetic markers for association tests. Pharmacogenomics 2: 11–24. - PubMed
-
- Chiano, M. N., and D. G. Clayton, 1998. Fine genetic mapping using haplotype analysis and the missing data problem. Ann. Hum. Genet. 62: 55–60. - PubMed
-
- Clark, A. G., 1990. Inference of haplotypes from PCR-amplified samples of diploid populations. Mol. Biol. Evol. 7: 111–122. - PubMed
Publication types
MeSH terms
Substances
LinkOut - more resources
Full Text Sources
Other Literature Sources
