. 2004 Dec 17;279(51):53848-56.
doi: 10.1074/jbc.M403114200. Epub 2004 Sep 28.

Epidermal growth factor receptor-deficient mice have delayed primary endochondral ossification because of defective osteoclast recruitment

Affiliations

Epidermal growth factor receptor-deficient mice have delayed primary endochondral ossification because of defective osteoclast recruitment

Ke Wang et al. J Biol Chem. .

Abstract

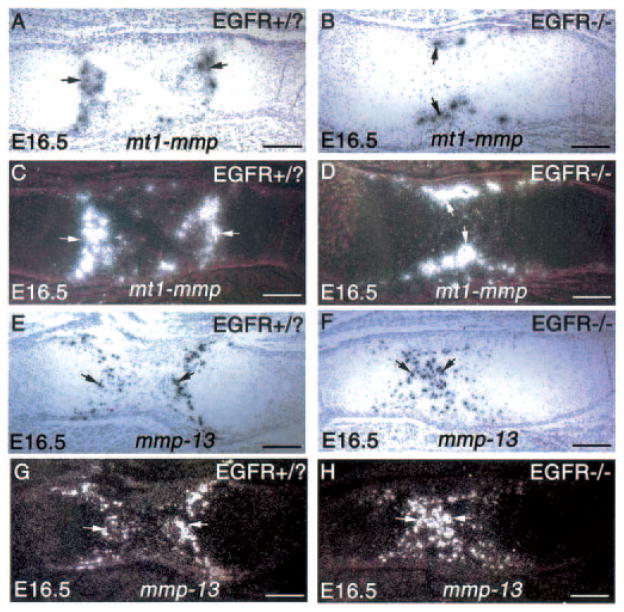
The epidermal growth factor receptor (EGFR) and its ligands function in diverse cellular functions including cell proliferation, differentiation, motility, and survival. EGFR signaling is important for the development of many tissues, including skin, lungs, intestines, and the craniofacial skeleton. We have now determined the role of EGFR signaling in endochondral ossification. We analyzed long bone development in EGFR-deficient mice. EGFR deficiency caused delayed primary ossification of the cartilage anlage and delayed osteoclast and osteoblast recruitment. Ossification of the growth plates was also abnormal resulting in an expanded area of growth plate hypertrophic cartilage and few bony trabeculae. The delayed osteoclast recruitment was not because of inadequate expression of matrix metalloproteinases, including matrix metalloproteinase-9, which have previously been shown to be important for osteoclast recruitment. EGFR was expressed by osteoclasts, suggesting that EGFR ligands may act directly to affect the formation and/or function of these cells. EGFR signaling regulated osteoclast formation. Inhibition of EGFR tyrosine kinase activity decreased the generation of osteoclasts from cultured bone marrow cells.


Figures

Fig. 1
Fig. 1. Long bone development in wild type and EGFR −/− mice
Trichrome Masson-stained tissue sections of the humerus of E16.5 (A and B), E18.5 (C and D, G and H), and newborn (E and F, I and J) wild type or heterozygous (A, C, E, G, and I) and EGFR−/− (B, D, F, H, and J) mice. At E16.5, vascularization of the calcified hypertrophic cartilage zone has already occurred in the wild type humerus with vascularized tissues replacing hypertrophic cartilage in the diaphysis (A, arrows), whereas invading capillaries remain at the outer edge of the calcified hypertrophic cartilage zone in EGFR−/− humerus (B, arrows). At E18.5, endochondral ossification has continued in the wild type humerus resulting in an area of trabecular bone and a normal sized growth plate (C), whereas there is still a large area of un-ossified hypertrophic cartilage in the EGFR−/− humerus (D). In newborn mice, there continues to be a large area of hypertrophic cartilage at the growth plate of EGFR−/− humerus (F) compared with wild type (E). Many long bony trabeculae are present in the metaphysis in wild type humerus at E18.5 (G, arrows) and at birth (I, arrows), but the bony trabeculae in EGFR−/− littermates are very few and short (H and J, arrows). Bar, A–F, 200 μm; G–J, 100 μm. Because heterogeneous mice did not show a bone phenotype, the EGFR wild type and heterozygote embryos were used interchangeably and are indicated as EGFR+/?.
Fig. 2
Fig. 2. Effect of EGFR deficiency on the number and distribution of TRAP+ cells in the developing humerus
Tissue sections of the humerus of E16.5 (A and B), E18.5 (C and D), and newborn (E and F) wild type or heterozygous (A, C, and E) and EGFR−/− (B, D, and F) mice stained for TRAP activity. In E16.5 wild type humerus, many TRAP+ cells were detected in the vascularized hypertrophic cartilage (A, arrows). However, in E16.5 EGFR−/− humerus, most of the TRAP+ cells were found at the periphery of the hypertrophic cartilage (B, arrows). In E18.5 (C and D) and newborn mice (E and F), there were just as many TRAP+ cells inside the bone rudiment in EGFR−/− humerus (D and F, arrows) as in the wild-type humerus (C and E, arrows). Bar, 100 μm. G, quantification of the number of TRAP+ cells in wild type and EGFR−/− humeri at different stages. Horizontal bars show mean counts of TRAP+ cells found either outside the calcified hypertrophic cartilage at the perichondrium/periosteum or inside the calcified hypertrophic cartilage. At E16.5, there is a significant difference in the total number of TRAP+ cells found outside versus inside the calcified hypertrophic cartilage between wild type and EGFR−/− mice (p < 0.05).
Fig. 3
Fig. 3. Expression of Cbfa-1, osteocalcin, and collagen type I in the humerus of wild type and EGFR −/− mice
A–H, bright field images of tissue sections of E16.5 (A–D) or E18.5 (E–H) humeri from wild type (A, C, E, and G) or EGFR−/− (B, D, F, and H) mice hybridized with 35S-labeled Cbfa-1 (A and B), osteocalcin (C–F), and collagen type I (G and H) antisense probes. In E16.5 wild type humerus, many Cbfa-1-positive cells were found in the middle section of the hypertrophic cartilage (A, arrows), whereas these cells are found largely at the periphery of the hypertrophic cartilage in EGFR−/− humerus (B, arrows). Similarly, osteocalcin (oc) expressing cells are found at the periphery of hypertrophic cartilage in E16.5 EGFR−/− (D, arrows) and in the middle of wild type hypertrophic cartilage (C, arrows). By E18.5, there were abundant osteocalcin-positive cells in the metaphysis of EGFR−/− humerus. However, these cells are found mainly at the cartilage-bone junction (F, arrows), and very few are found in the primary spongiosa, which also contain very few trabecular spicules (F, arrowhead). In contrast, in the E18.5 wild type humerus there are abundant osteocalcin-positive cells both at the cartilage-bone junction (E, arrows) and in the primary spongiosa on trabecular spicules (E, arrowheads). Collagen type I expression was found in the metaphysis in both wild type and EGFR−/− E18.5 humerus (G and H, arrows). Bar, 200 μm.
Fig. 4
Fig. 4. RT-PCR and Northern blot analysis of EGFR mRNA in cultured osteoclasts
A, RT-PCR with EGFR-specific primers of total RNA isolated from cultured osteoclasts, wild type embryonic heads, and EGFR−/− heads. The expected 499-bp PCR product was seen in RNA from osteoclast and wild type embryonic head, but not in EGFR−/− head. B, Northern blot of total RNA isolated from cultured osteoclasts, wild type embryonic heads, and EGFR−/− heads hybridized with a 32P-labeled EGFR probe. Two transcripts, 9.6 and 5.0 kb in size, were detected in RNA from osteoclasts and wild type embryonic head, but not from EGFR−/− head.
Fig. 5
Fig. 5. Expression of MMP-9 in the humeri of wild type/homozygous and EGFR −/− mice
A–D, bright field (A and B) and dark field (C and D) images of tissue sections of E16.5 humerus from wild type (A and C) or EGFR−/− (B and D) mice hybridized with 35S-labeled MMP-9 antisense probe. MMP-9 expression was found in cells inside the vascularized hypertrophic cartilage, including at the cartilage-bone junction in wild type humerus (A and C, arrows), and in cells at the outer edge of the calcified hypertrophic cartilage in EGFR−/− humerus (B and D, arrows). E–H, bright field (E and F) and dark field (G and H) images of tissue sections of E18.5 humerus from wild type (E and G) or EGFR−/− (F and H) mice hybridized with 35S-labeled MMP-9 antisense probe. Similar number and distribution of MMP-9 expressing cells were found in both wild type and EGFR−/− humerus. I, gelatin zymogram of tissue lysates from the long bones of wild type and EGFR−/− mice showing a slightly decreased level of both latent and activated gelatinase B (Gel Ba) in EGFR−/− bones and a normal level of latent and activated gelatinase A (Gel Aa). Bar (A–H), 200 μm.
Fig. 6
Fig. 6. Expression of MMP-14 (MT1-MMP) and MMP-13 (colla-genase 3) in the wild type and EGFR −/− humeri
A–D, bright field (A and B) and dark field (C and D) images of tissue sections of E16.5 humeri from wild type (A and C) or EGFR−/− (B and D) mice hybridized with 35S-labeled MMP-14 antisense probe. Similar to MMP-9, MMP-14 expression was found in cells inside the vascularized hypertrophic cartilage, including at the cartilage-bone junction in wild type humerus (A and C, arrows), and in cells at the outer edge of the calcified hypertrophic cartilage in EGFR−/− humerus (B and D, arrows). E–H, bright field (E and F) and dark field (G and H) images of tissue sections of E16.5 humeri from wild type (E and G) or EGFR−/− (F and H) mice hybridized with 35S-labeled MMP-13 antisense probe. MMP-13 expression was found in the lower hypertrophic chondrocytes adjacent to the vascularized area in wild type humerus (E and G, arrows), and in chondrocytes of the calcified hypertrophic cartilage in EGFR−/− humerus (F and H, arrows). Bar: 200 μm.
Fig. 7
Fig. 7. Effect of the inhibition of EGFR signaling on osteoclast formation
A–D, TRAP staining of bone marrow cells cultured for 6 days with RANKL (25 ng/ml), M-CSF (25 ng/ml), and either vehicle or increasing concentrations of the EGFR tyrosine kinase inhibitor AG1478 (1.25, 2.5, and 5 μM). In vehicle-treated cultures, there were a large number of multinucleated TRAP+ cells characteristic of osteoclasts (A). Treatment with AG1478 caused a dose-dependent decrease in the number of multinucleated TRAP+ cells (B–D). E, quantification of the number of osteoclasts developed in control cultures and cultures with different concentrations of AG1478. Each histogram represents the mean number of total osteoclasts counted in three wells of a 24-well plate. F, effects of EGFR signaling inhibition on proliferation of bone marrow mononuclear cells. Wild type bone marrow mononuclear cells were isolated and cultured for 2 days in the presence of RANKL (25 ng/ml), M-CSF (25 ng/ml), and either vehicle or increasing concentrations of the EGFR tyrosine kinase inhibitor AG1478 (1.25, 2.5, and 5 μM). 3-(4,5-Dimethylthiazol-2-yl)-2,5-diphenyltetrazolium bromide uptake was assessed by absorbance and used as a measure of cell number. AG1478 caused a dose-dependent decrease in cell number as reflected by the decrease in absorbance. Each histogram represents the mean value of six replicates. The experiments were repeated three times with similar results.
Fig. 8
Fig. 8. Effect of the inhibition of EGFR signaling on osteoclast function
A, images of the resorption pits formed by osteoclasts on calcium phosphate-coated discs. Bone marrow cells were cultured on calcium phosphate-coated discs in the presence of M-CSF and RANKL to form osteoclasts before switching to resorptive media containing vehicle control (Me2SO) or AG1478 (5 μM) for 2 days. B, quantitative analyses of the area of resorption as a percentage of the total area corresponding to an osteoclast. Data are presented as mean ± S.D. (error bars) of 35 osteoclasts analyzed. There was no significant difference between Me2SO (DMSO) and AG1478 treated groups (p =−0.36)

References

    1. Caplan AI. Ciba Found Symp. 1988;136:3021. - PubMed
    1. Olsen BR, Reginato AM, Wang W. Annu Rev Cell Dev Biol. 2000;16:191–220. - PubMed
    1. Karsenty G, Wagner EF. Dev Cell. 2002;2:389–406. - PubMed
    1. Hackel PO, Zwick E, Prenzel N, Ullrich A. Curr Opin Cell Biol. 1999;11:184–189. - PubMed
    1. Bogdan S, Klambt C. Curr Biol. 2001;11:R292–R295. - PubMed

Publication types

MeSH terms