. 2004 Sep 29;24(39):8441-53.
doi: 10.1523/JNEUROSCI.1400-04.2004.

A quantitative map of the circuit of cat primary visual cortex

Affiliations

A quantitative map of the circuit of cat primary visual cortex

Tom Binzegger et al. J Neurosci. .

Abstract

We developed a quantitative description of the circuits formed in cat area 17 by estimating the "weight" of the projections between different neuronal types. To achieve this, we made three-dimensional reconstructions of 39 single neurons and thalamic afferents labeled with horseradish peroxidase during intracellular recordings in vivo. These neurons served as representatives of the different types and provided the morphometrical data about the laminar distribution of the dendritic trees and synaptic boutons and the number of synapses formed by a given type of neuron. Extensive searches of the literature provided the estimates of numbers of the different neuronal types and their distribution across the cortical layers. Applying the simplification that synapses between different cell types are made in proportion to the boutons and dendrites that those cell types contribute to the neuropil in a given layer, we were able to estimate the probable source and number of synapses made between neurons in the six layers. The predicted synaptic maps were quantitatively close to the estimates derived from the experimental electron microscopic studies for the case of the main sources of excitatory and inhibitory input to the spiny stellate cells, which form a major target of layer 4 afferents. The map of the whole cortical circuit shows that there are very few "strong" but many "weak" excitatory projections, each of which may involve only a few percentage of the total complement of excitatory synapses of a single neuron.


Figures

Figure 3.
Figure 3.
Coronal view of a reconstructed layer 6 pyramidal cell. The axon is shown in red, boutons are in white, and dendrites are in green. Cortical layers are indicated by gray curves. Receptive field: simple (s1), monocular driven, preferred orientation at 60°; size, 0.3 × 0.5°. wm, White matter.
Figure 1.
Figure 1.
Peters's rule. Depicted is the situation where a typical neuron of cell type i has its apical dendrite in layer u (indicated by black lines). Neurons innervating this layer form synapses (indicated by closed and open circles) with the dendritic branches in this layer (indicated by gray lines), including the apical dendrite of neuron i (indicated by closed and open gray dots). Synapses belonging to the neurons of cell type j are indicated by closed dots. In this instance, Peters's rule specifies the number of synapses that all neurons of cell type j form with the apical dendrite of neuron i(the closed gray dots) according to the following equation:formula image. Here, formula image is the total number of synapses in layer u that are formed by the neurons of type j (i.e., the number of closed dots). Du is the summed length of all dendritic branches in layer u (i.e., the sum of the length of all gray lines and the apical dendrite indicated in black), and formula image is the (average) length of the dendrites formed by the neurons of type i in layer u (i.e., the sum of the branches of the black apical dendrite). Intuitively, the formula image synapses are evenly distributed about all dendritic segments in the layer, so that the number of synapses per dendritic length is formula image. Multiplying with the length formula image results in the number of synapses that are formed with the emphasized black apical dendrite.
Figure 2.
Figure 2.
Coronal view of reconstructed cells representing the different cell types present in the database. For better viewing, two-color schemes (blue and yellow) were used. Axons are shown in bright blue or bright yellow, and dendrites are shown in dark blue or dark yellow. Boutons are skipped for visibility. Cell types are indicated at the top. b2/3, b4, b5, Basket cells in layer 2/3, 4, and 5; db2/3, double bouquet cell in layer 2/3; p2/3, p4, p5, p6, pyramidal cells in layer 2/3, 4, 5, and 6; ss4, spiny stellate cells in layer 4. Spiny stellate cells and pyramidal cells in layer 5 and 6 were further distinguished by the preferred layer of the axonal innervation [ss4(L4) (data not shown), ss4(L2/3), p5(L2/3), p5(L5/6), p6(L4) and p6(L5/6)]. X/Y thalamic afferents of type X and Y. Horizontal lines indicate the approximate cortical layers L1, L2/3 (layer 2 and 3 were merged), L4, L5, and L6. Also indicated is the white matter (wm). Scale bar, 300 μm.
Figure 4.
Figure 4.
Synaptic laminar pattern of cell types. For each cell type (indicated along the x-axis), the average number of boutons (black bars) and the average number of synapses (gray bars) that the reconstructed neurons of this type form in each cortical layer (indicated along y-axis) are shown. The average number of synapses per layer is the product of the average number of boutons per layer and the ratio of the number of synapses per bouton for this cell type. The ratios are as follows: pyramidal cells in layer 2/3 and 5, 1.0 (Kisvárday et al., 1986; Gabbott et al., 1987); spiny stellate cells in layer 4, 0.95 (Anderson et al., 1994a); basket cells in layer 2/3, 1.03 (Buhl et al., 1997); double bouquet cells in layer 2/3, 1.09 (Buhl et al., 1997); basket cells in layer 4, 1.14 (Somogyi et al., 1983). X-type thalamic afferents had a ratio of 1.27 (Freund et al., 1985), and Y-type afferents had a ratio of 1.30 (McGuire et al., 1984) in one study and 1.64 in another study (Freund et al., 1985). We used the average of the two numbers, 1.47. For the remaining cell types, no experimental data were available, and we assumed an average number of synapses per bouton of 1.0. Layer 4 is indicated by the gray background. SDs are indicated above each bar.
Figure 5.
Figure 5.
Dendritic laminar pattern of cell types. Gray bars indicate for each cell type (indicated along the x-axis) the averaged summed length of the dendritic branches that the reconstructed neurons of this type form in a each cortical layer (indicated along y-axis). White bars indicate estimates of the average dendritic length for the cell types not present in the database. sp1, Spiny cells in layer 1; sm1, sm2/3, sm4, sm5, and m6 are all smooth cells in the corresponding layer that do not belong to any of the cell types b2/3, db2/3, b4, and b5. SDs are indicated.
Figure 6.
Figure 6.
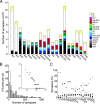
Estimated number of cells per cell type. A, Each bar indicates the estimated number of neurons per cell type (x-axis). B, Estimated total number of synapses in each cortical layer, based on A and Figure 4. For each layer (x-axis), the left bar indicates the estimated number of asymmetric synapses, and the right bar indicates the estimated symmetric synapses. Superimposed are the number of asymmetric (closed circles) and symmetric (open circles) synapses determined by Beaulieu and Colonnier (1985). C, Gray bars indicate the summed length of dendritic branches of all reconstructed cell types (left bars, spiny neurons; right bars, smooth neurons) innervating the cortical layers (indicated by the long x-axis). White bars on top of the gray bars indicate the summed length of dendritic branches formed by the cell types for which no example was present in the database. These cell types are indicated in Figure 5 (white bars).
Figure 7.
Figure 7.
Estimated number of synapses formed by one type of neuron with another type in the cortical layer indicated based on Peters's rule (Eqs. 2, 3). L1-L6, Presynaptic cell types are indicated on the top, postsynaptic cell types are indicated along the y-axis. For a presynaptic cell type j and a postsynaptic cell type i, the color of the corresponding square indicates the number of synapses that all neurons of type j form in layer u (indicated on the top left corner) with an individual neuron of type i. This number is denoted by formula image in Figure 1. Light gray squares indicate zero values. sy and as indicate the number of unassigned asymmetric and symmetric synapses on the dendritic trees of each cell type. Color bars are shown.
Figure 8.
Figure 8.
Same as for Figure 7, but only the weak projections (those forming < 800 synapses) are color coded. The stronger projections are shown in white.
Figure 9.
Figure 9.
Number of synapses per neuron. A, Average number of synapses formed with neurons, calculated from Figure 7. Each bar indicates the number of synapses that a neuron of a given cell type (indicated along the x-axis) receives in each cortical layer (indicated along the y-axis). B, Summing over the cortical layers in A results in the total number of synapses a neuron of a given cell type (x-axis) receives. C, Dividing this number by the summed length of the dendritic branches of the dendritic trees results in the overall synaptic density of synapses along the dendritic trees of cortical cell types.
Figure 10.
Figure 10.
Proportion of synapses (Prop syn) on layer 4 neurons. Bars indicate our estimate of the proportion of synapses that the cell types (indicated along the x-axis) form with a spiny stellate cell (light shaded bars) and a basket cell (dark shaded bars) in layer 4. The estimates are based on Figure 7. as(L4) and sy(L4) indicate the proportion of unassigned asymmetric and symmetric synapses. ss4 indicates the cell types p4, ss4(L4), and ss4(L2/3), which we pooled for the calculations. Error bars indicate the variability in the proportions due to variations in cell number (see Results). Each circle indicates the proportion of synapses that the cell types formed with a spiny stellate cell (light shaded circles) and a basket cell (dark shaded circles). Data are based on the studies by Ahmed et al. (1994, 1997).
Figure 11.
Figure 11.
Number of synapses formed by the different cell types with an individual neuron. A, Each total bar indicates the number of synapses formed with a neuron of a given cell type (indicated along the x-axis). The width of each color-coded subdivision of the bar indicates the total number of synapses that a particular presynaptic cell type forms with the neurons. The correspondence between the colors and the presynaptic cell types is indicated. B, Histogram of synapses formed by the different cell types with an individual neuron, as shown in A. For visibility, projections forming < 1000 synapses are shown only. Gray bars indicate the histogram of asymmetric synapses. Bin size is 50 synapses. Inset shows the histogram of synapses formed by all projections (log-log scale). C, For each postsynaptic cell type (x-axis), the three largest proportions of synapses of its dendritic trees that were formed by the different cell types are shown (closed circles). Also shown for each cell type is the proportion of unassigned synapses on its dendritic trees (open circles).
Figure 12.
Figure 12.
Number of synapses involved in the projections between excitatory and inhibitory neurons between layers, including the X-type and Y-type afferents from the dorsal LGN. The numbers were calculated based on Figure 7. A-D, Each arrow is labeled with a number indicating the proportion of all the synapses in area 17 that are formed between excitatory neurons (A), from excitatory onto inhibitory neurons (B), from inhibitory onto excitatory neurons (C), and between inhibitory neurons (D). A, Total number of synapses between excitatory neurons is 13.6 × 10¹⁰. The proportion of asymmetric unassigned synapses that the excitatory neurons in each layer receive is 0.1% (layer 1), 6% (layer 2/3), 10% (layer 4), 2% (layer 5), and 12% (layer 6). These synapses are presumably formed by the afferents originating outside area 17. B, Total number of synapses from excitatory neurons onto inhibitory neurons is 2.1 × 10¹⁰. The proportion of asymmetric unassigned synapses that the inhibitory neurons in each layer receive is 17% (layer 1), 5% (layer 2/3), 9% (layer 4), 0.5% (layer 5), and 11% (layer 6). C, Total number of synapses from inhibitory neurons onto excitatory neurons is 2.4 × 10¹⁰. The proportion of symmetric unassigned synapses that the excitatory neurons in each layer receive is 0.1% (layer 1), 6% (layer 2/3), 12% (layer 4), 6% (layer 5), and 19% (layer 6). D, Total number of synapses between inhibitory neurons is 0.4 × 10¹⁰. The proportion of symmetric unassigned synapses that the inhibitory neurons in each layer receive is 11% (layer 1), 5% (layer 2/3), 10% (layer 4), 4% (layer 5), and 15% (layer 6).

Similar articles

Cited by

References

    1. Ahmed B, Anderson JC, Douglas RJ, Martin KAC, Nelson JC (1994) Polyneuronal innervation of spiny stellate neurons in cat visual cortex. J Comp Neurol 341: 39-49. - PubMed
    1. Ahmed B, Anderson JC, Martin KAC, Nelson JC (1997) Map of the synapses onto layer 4 basket cells of the primary visual cortex of the cat. J Comp Neurol 380: 230-242. - PubMed
    1. Ahmed B, Anderson JC, Douglas RJ, Martin KAC, Whitteridge D (1998) Estimates of the net excitatory currents evoked by visual stimulation of identified neurons in cat visual cortex. Cereb Cortex 8: 462-476. - PubMed
    1. Alcantara S, Ferrer I (1994) Postnatal development of parvalbumin immunoreactivity in the cerebral cortex of the cat. J Comp Neurol 348: 133-149. - PubMed
    1. Anderson JC, Douglas RJ, Martin KAC, Nelson JC (1994a) Synaptic output of physiologically identified spiny stellate neurons in cat visual cortex. J Comp Neurol 341: 16-24. - PubMed

Publication types

MeSH terms