. 2004 Sep 29;24(39):8459-69.
doi: 10.1523/JNEUROSCI.1527-04.2004.

Visual response properties in the dorsal lateral geniculate nucleus of mice lacking the beta2 subunit of the nicotinic acetylcholine receptor

Affiliations

Visual response properties in the dorsal lateral geniculate nucleus of mice lacking the beta2 subunit of the nicotinic acetylcholine receptor

Matthew S Grubb et al. J Neurosci. .

Abstract

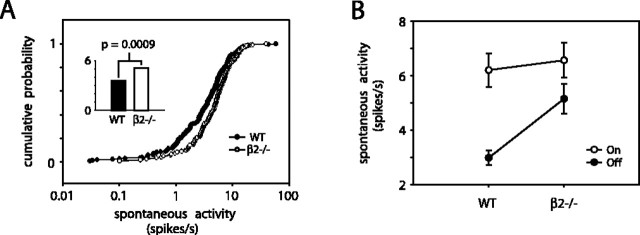
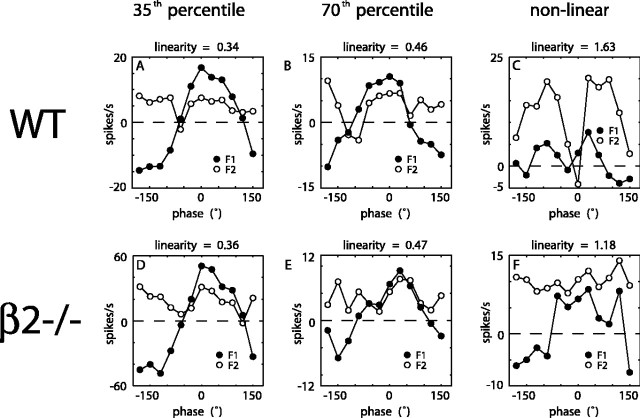
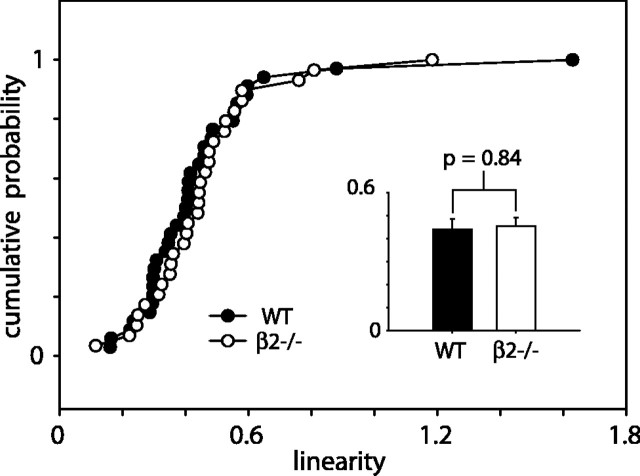
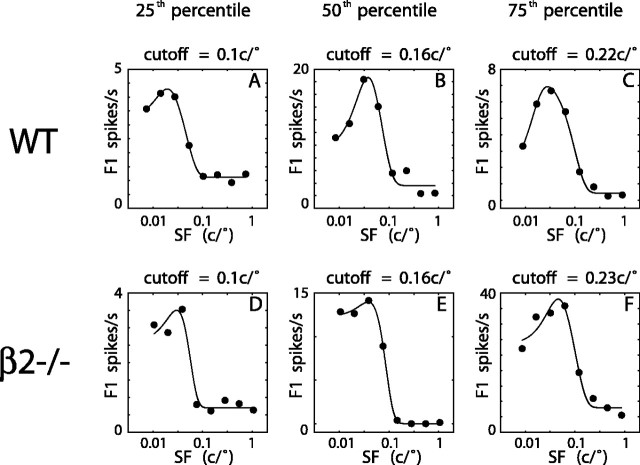
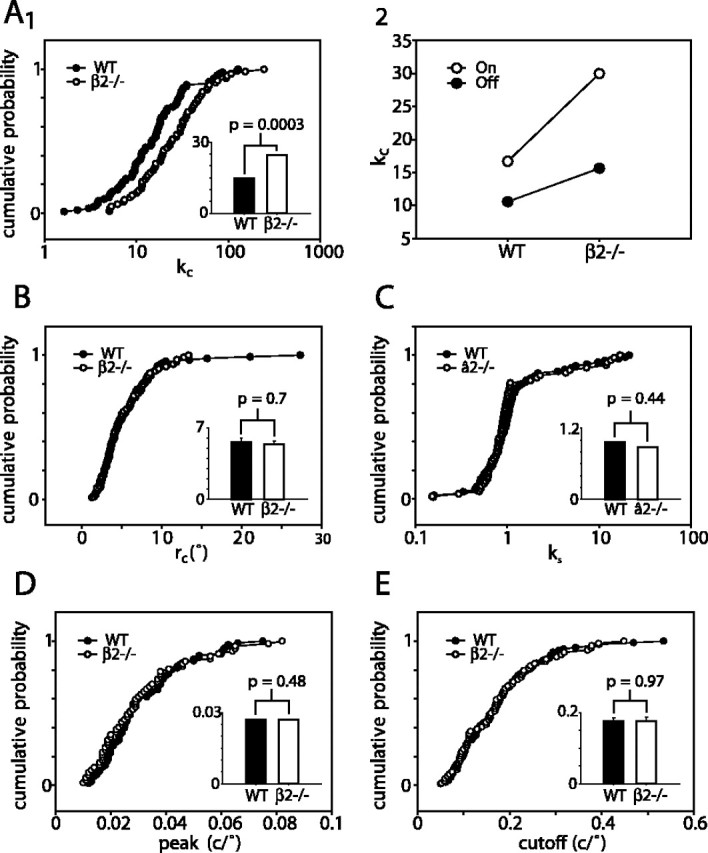
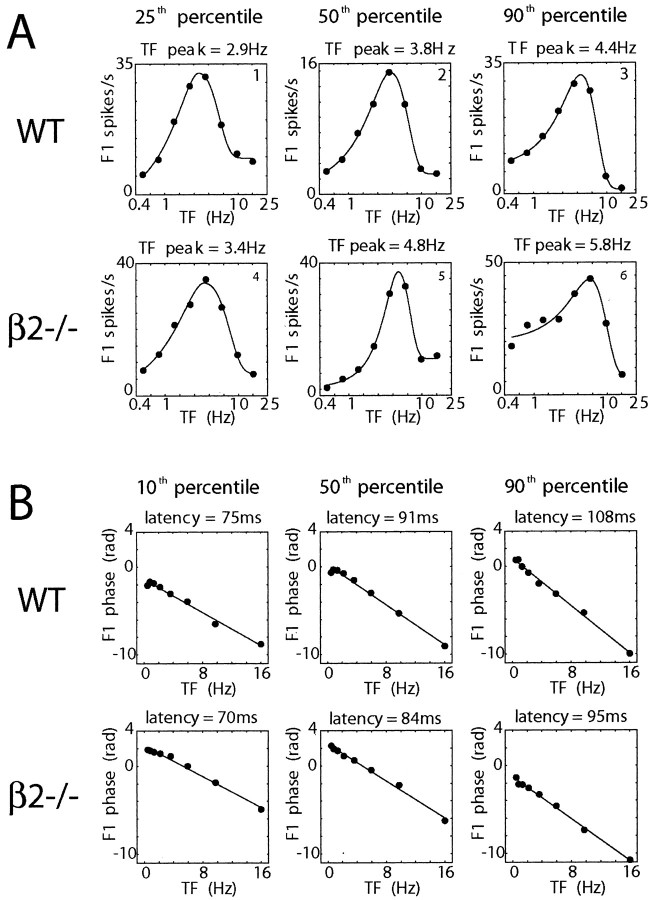
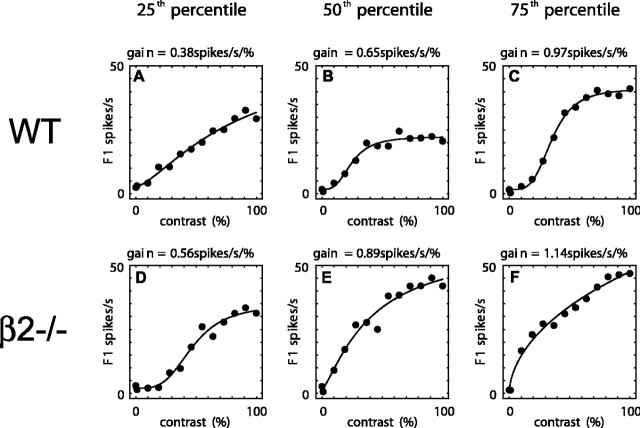
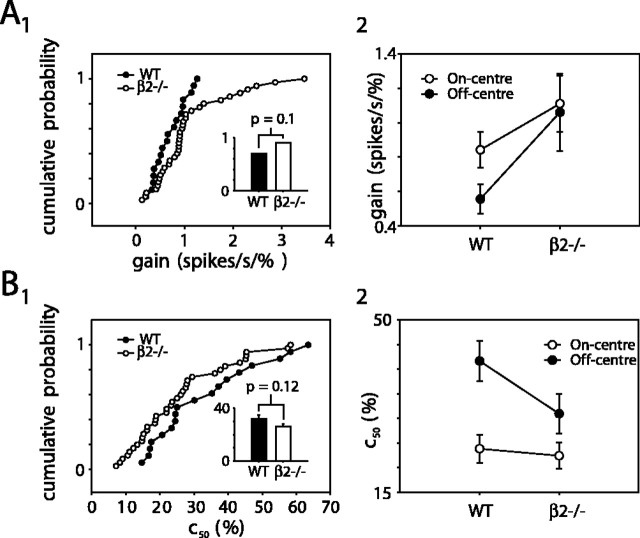
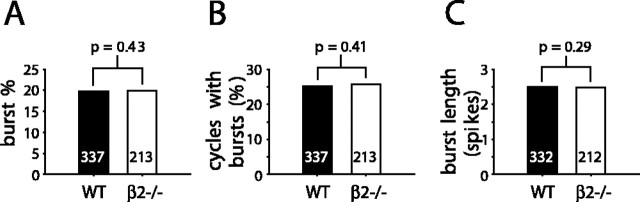
We present a quantitative description of single-cell visual response properties in the dorsal lateral geniculate nucleus (dLGN) of anesthetized adult mice lacking the beta2 subunit of the nicotinic acetylcholine receptor (beta2-/-) and compare these response properties with data from wild-type animals. Some response features, including all spatial receptive field characteristics and bursting behavior, are entirely normal in beta2-/- dLGN cells. In other respects, the responses of beta2-/- dLGN cells are quantitatively abnormal: the mutation is associated with higher spontaneous and visually evoked firing rates, faster visual response latencies, a preference for higher temporal frequencies, and a trend toward greater contrast sensitivity. The normal response properties in the beta2-/- dLGN show that none of the many effects of the mutation, including disrupted geniculate functional organization and abnormal cholinergic transmission, have any effect on spatial response characteristics and bursting behavior in dLGN neurons. The abnormal response characteristics in the beta2-/- dLGN are most interesting in that they are no worse than normal; any visual processing deficits found in studies of the beta2-/- visual cortex must therefore arise solely from abnormalities in cortical processing.


Figures

Figure 1.
Figure 1.
Spontaneous activity is higher in the β2-/- dLGN. A, A cumulative probability plot reveals a marked difference in spontaneous activity levels between the two samples: β2-/- neurons tend to fire more spontaneous spikes. Note the logarithmic x-axis. Inset, The bar plot confirms that the medians of the two distributions are significantly different (WT, 3.6 spikes/sec;β2-/-, 5.14 spikes/sec; Mann-Whitney U test; p = 0.0009). B, Mean spontaneous firing levels in On-center and Off-center cells in the WT and β2-/- dLGN. Spontaneous activity is higher in the β2-/- dLGN and in On-center cells, although the largest difference between the two genotypes occurs in Off-center spontaneous firing. The error bars show SEM.
Figure 2.
Figure 2.
Examples of modified null tests of spatial summation in three WT and three β2-/- dLGN cells. Cells were presented with stationary sinusoidal gratings of various spatial phases, the contrast of which was counterphased sinusoidally. Responses at the fundamental (F1) and second (F2) stimulus harmonics were used to calculate an index of linearity of spatial summation (Hochstein and Shapley, 1976; Grubb and Thompson, 2003) (see Materials and Methods). Neurons were ranked according to their linearity values, and plots for cells at the 35th and 70th percentiles are shown. By convention, F1 responses are represented as negative when their phase differs from that of the maximum F1 response by 90-270°. Almost all cells in both WT and β2-/- mice exhibited X-cell-like linear summation, in which F1 response amplitude varies sinusoidally with stimulus phase and two crossings of the zero line represent null positions (A, B, D, E). In these cells, maximum F1 responses were larger than mean F2 responses, producing linearity values that are <1 and therefore indicative of linear spatial summation (Hochstein and Shapley, 1976). Note the close similarity of linearity values for cells at similar percentiles in the two groups (A vs D, B vs E). One neuron in each group, however, displayed significant nonlinearity in its spatial summation. In both cases, this nonlinearity was reflected in a linearity value >1. In the WT sample, the nonlinearity was not Y-cell-like: although F2 responses were always larger than F1 responses, F2 amplitude varied sinusoidally with stimulus phase (C). In the β2-/- sample, the nonlinearity was classically Y-cell like: at a high SF for this cell (0.04 c/°), F2 responses were always higher than (sinusoidally varying) F1 responses but did not vary sinusoidally with stimulus phase (F).
Figure 3.
Figure 3.
There was no difference in spatial summation between WT and β2-/- dLGN cell samples. The main cumulative probability plot shows very little difference in the distributions of linearity values in the two samples, whereas the bar plot (inset) shows that the means of the two groups are not significantly different (mean ± SEM: WT, 0.44 ± 0.04; β2-/-, 0.45 ± 0.04; t test; p = 0.84). The error bars show SEM.
Figure 4.
Figure 4.
Examples of SF tuning in three WT and three β2-/-dLGN cells. The circles show F1 response amplitudes to drifting sinusoidal gratings of varying SF (TF, 1 Hz; contrast, 70%); the lines show the best-fitting DoG curve to these data. Neurons were ranked according to their SF cutoff (see Results), and plots for cells at the 25th, 50th, and 75th percentiles are shown. In both WT and β2-/- mice, cells responded best to very low SFs. SF tuning in both samples was extremely similar: most WT and β2-/- neurons were like those presented in being bandpass tuned for SF, and the similarity in cutoff values for cells at similar percentiles in the two samples is striking. Spatial tuning parameters for all example cells: A: kc, 5.28; ks, 0.50; rc, 6.79°; rs, 22.15°; peak, 0.02 c/°; cutoff, 0.10 c/°; B: kc, 28.25; ks, 0.79; rc, 4.49°; rs, 11.78°; peak, 0.038 c/°; cutoff, 0.16 c/°; C: kc, 7.63; ks, 0.87; rc, 3.22°; rs, 22.12°; peak, 0.028 c/°; cutoff, 0.22 c/°; D: kc, 40.78; ks, 0.95; rc, 8.3°; rs, 8.89°; peak, 0.03 c/°; cutoff, 0.1 c/°; E: kc, 52.19; ks, 0.77; rc, 4.87°; rs, 6.16°; peak, 0.038 c/°; cutoff, 0.16 c/°; F: kc, 51.43; ks, 0.58; rc, 3.14°; rs, 9.45°; peak, 0.046 c/°; cutoff, 0.23 c/°.
Figure 5.
Figure 5.
Comparison of SF tuning in the WT and β2-/- dLGN. A, RF center strength, kc, is higher in β2-/- dLGN cells. The cumulative probability plot (1) shows that kc values across the β2-/- sample tend to be larger than those in the WT sample (note the logarithmic x-axis), whereas the bar plot (inset) shows that the medians of these two samples are significantly different (median: WT, 14.9;β2-/-, 24.5; Mann-Whitney U test; p = 0.0003). Plot 2 shows that median kc is higher in both On-center and Off-center cells in theβ2-/- dLGN, but more so in On-center cells. B, The RF center radius, rc, does not differ between WT and β2-/- dLGN cells. The distributions of values in the two samples are almost identical (note the logarithmic x-axis), and the means of these samples are not significantly different (mean ± SEM: WT, 5.6 ± 0.4°; β2-/-, 5.4 ± 0.4°;t test; p = 0.7). The error bars show SEM. C, ks, RF surround strength, is no different in WT and β2-/- dLGN cells. Distributions of values in the two samples are extremely similar. The bar plot (inset) shows that the medians of the two samples do not differ significantly (median: WT, 0.97; β2-/-, 0.88; Mann-Whitney U test; p = 0.44). D, Peak SF is not different in the WT and β2-/- dLGN. The distributions of values in the two samples overlap considerably, and their medians are not significantly different (median: WT, 0.027 c/°; β2-/-, 0.027 c/°; Mann-Whitney U test; p = 0.48). E, The WT and β2-/- dLGN do not differ in terms of spatial acuity. Distributions of SF cutoff values are almost identical in the two groups, and the means of these samples are not significantly different(mean ± SEM: WT, 0.18 ± 0.009c/°;β2-/-,0.18 ± 0.01c/°;ttest,p=0.97). The error bars show SEM.
Figure 6.
Figure 6.
Examples of TF tuning in WT and β2-/- dLGN cells. Cells were presented with drifting sinusoidal gratings of varying TF (SF, optimal; contrast, 70%). A, The circles show response amplitudes at the fundamental stimulus harmonic (F1); the solid lines show the best two half-Gaussian fits to these data. Note the logarithmic x-axis. Cells were ranked according to their TF peak, and plots for cells at the 25th, 50th, and 75th percentiles are shown. All cells show bandpass TF tuning, with response amplitude decreasing with distance from peak TF. Neurons in β2-/- mice prefer higher TFs than WT cells at similar percentiles. TF tuning characteristics for all example cells: cell 1: peak, 2.9 Hz; high50, 6.3 Hz; cell 2: peak, 3.8 Hz; high50, 7.1 Hz; cell 3: peak, 4.4 Hz; high50, 7.5 Hz; cell 4: peak, 3.4 Hz; high50, 7.8 Hz; cell 5: peak, 4.8 Hz; high50, 7.5 Hz; cell 6: peak, 5.8 Hz; high50, 10.5 Hz. B, The circles show F1 response phases, whereas the solid lines show the best linear fits to these data. Cells were ranked according to their latency, calculated as the slope of the best-fitting TF phase line (Hawken et al., 1996; Grubb and Thompson, 2003). Plots for cells at the 10th, 50th, and 90th percentiles are shown. Although slopes appear to vary rather little between WT and β2-/- samples, cells in the β2-/- dLGN tend to have shorter latencies than WT neurons at similar percentiles.
Figure 7.
Figure 7.
Comparison of TF tuning in the WT and β2-/- dLGN. A, β2-/- dLGN cells prefer higher TFs. The cumulative probability plot (1) shows the β2-/- distribution shifted toward higher peak TF values, whereas the bar plot shows that the β2-/- mean peak TF is significantly higher than WT (mean ± SEM: WT, 3.9 ± 0.2 Hz; β2-/-, 4.9 ± 0.3 Hz; t test; p = 0.02). The error bars show SEM. Plot 2 shows that peak TF means are higher for both On-center and Off-center cells in the β2-/- dLGN. B, High50 values are higher in the β2-/- dLGN. The high50 distribution in theβ2-/- sample is clearly shifted toward higher values, and the mean of this sample is significantly greater than that of WT cells (mean ± SEM: WT, 7.3 ± 0.4 Hz; β2-/-, 9.2 ± 0.4 Hz; t test; p = 0.001). The error bars show SEM. Plot 2 shows that high50 means are higher for both On-center and Off-center cells in the β2-/- dLGN. C, β2-/- dLGN cells have shorter response latencies than WT dLGN neurons. The distribution ofβ2-/- latency values is only slightly shifted from that of WT latencies, but the medians of the two samples are significantly different nonetheless (median: WT, 92 msec; β2-/-, 84 msec; Mann-Whitney U test; p = 0.002). Plot 2 shows that latency medians are lower for both On-center and Off-center cells in the β2-/- dLGN.
Figure 8.
Figure 8.
Examples of contrast response characteristics in three WT and three β2-/- dLGN cells. The circles show F1 response amplitudes to drifting sinusoidal gratings of varying contrast (SF/TF, optimal); the lines show the best-fitting hyperbolic curve to these data (see Materials and Methods). Cells were ranked according to contrast gain (see Results), and plots for cells at the 25th, 50th, and 75th percentiles are shown. Neurons in theβ2-/- dLGN tended to be more responsive to contrast than their WT counterparts: gain values at similar sample percentiles are higher for β2-/- cells. Contrast response data for all example cells: A: gain, 0.38 spikes/sec/%; c50, 43.3%; B: gain, 0.65 spikes/sec/%; c50, 24.5%; C: gain, 0.97 spikes/sec/%; c50, 35.3%; D: gain, 0.56 spikes/sec/%; c50, 45.4%; E: gain, 0.89 spikes/sec/%; c50, 27.6%; F: gain, 1.14 spikes/sec/%; c50, 25.0%.
Figure 9.
Figure 9.
Comparison of contrast response characteristics in WT and β2-/- dLGN. A, A trend toward higher contrast gain in β2-/- dLGN cells. The cumulative probability plot (1) indicates that cells in the β2-/- sample tend to have higher contrast gain than their WT counterparts. The bar plot (inset), however, shows that the medians of the two samples are not significantly different (median: WT, 0.7 spikes/sec/%; β2-/-, 0.9 spikes/sec/%; Mann-Whitney U test; p = 0.1). Plot 2 shows mean ± SEM for On-center and Off-center cells in both samples (mean ± SEM is shown here because a parametric ANOVA test was used to analyze these data). On-center and Off-center cells in theβ2-/- dLGN have higher mean gain values than both cell types in the WT dLGN, but the effect of genotype is not quite significant on a two-wayANOVA(F(1,49) =3.88;p=0.055). Although On-center cell shave significantly higher gain than Off-center cells in the WT dLGN (Grubb and Thompson, 2003), this is not the case in β2-/- mice. Neither the effect of RF center type (F(1,49) = 0.71; p = 0.4) nor the center type × genotype interaction (F(1,49) = 0.37; p = 0.5) are significant. Mean ± SEM values: WT On-center, 0.84 ± 0.1 spikes/sec/%; WT Off-center, 0.56 ± 0.08 spikes/sec/%; β2-/- On-center, 1.11 ± 0.16 spikes/sec/%; β2-/- Off-center, 1.06 ± 0.22 spikes/sec/%. The error bars show SEM. B, A weaker trend toward lower c50 values in the β2-/- dLGN. Plot 2 shows that β2-/- neurons generally have slightly lower c50 values than cells in the WT dLGN. The difference between the means of the two samples, however, is not significantly different (mean ± SEM: WT, 32 ± 3%; β 2-/-, 26 ± 2%; t test; p = 0.12). Plot 2 shows mean ± SEM for On-center and Off-center cells in both samples. On-center c50 means differ little between genotypes, but Off-center means are much lower in β2-/- dLGN cells. The effect of genotype is not significant, however (F(1,49) = 2.8; p = 0.1). The effect of RF center type is significant, with On-center c50 values significantly lower across both genotype groups (F(1,49) = 13.1; p = 0.001). The genotype × center-type interaction is not significant (F(1,49) = 1.6; p = 0.2). Mean ± SEM values: WT On-center, 24 ± 3%; WT Off-center, 42 ± 4%;β2-/- On-center, 22 ± 3%; β2-/- Off-center, 31 ± 4%. The error bars show SEM.
Figure 10.
Figure 10.
No difference in bursting activity between WT and β2-/- dLGN cells. Plots show median values for WT and β2-/- dLGN cells across all tuning curve experiments. The numbers within the bars show the numbers for each sample. WT and β2-/- dLGN neurons do not differ with respect to the percentage of spikes that form part of bursts (burst %; median: WT, 19.8%; β2-/-, 20.0%; Mann-Whitney U test; p = 0.43; A), the percentage of presented stimulus cycles that evoked at least one burst (cycles with bursts; median: WT, 25.1%; β2-/-, 25.8%; Mann-Whitney U test; p = 0.41; B) or the length of each burst (burst length; median: WT, 2.5 spikes; β2-/-, 2.49 spikes; Mann-Whitney U test; p = 0.29; C).

Similar articles

Cited by

References

    1. Albrecht DG, Hamilton DB (1982) Striate cortex of monkey and cat: contrast response function. J Neurophysiol 48: 217-237. - PubMed
    1. Alitto HJ, Usrey WM (2003) Corticothalamic feedback and sensory processing. Curr Opin Neurobiol 13: 440-445. - PubMed
    1. Bansal A, Singer JH, Hwang BJ, Xu W, Beaudet A, Feller MB (2000) Mice lacking specific nicotinic acetylcholine receptor subunits exhibit dramatically altered spontaneous activity patterns and reveal a limited role for retinal waves in forming ON and OFF circuits in the inner retina. J Neurosci 20: 7672-7681. - PMC - PubMed
    1. Chen C, Regehr WG (2000) Developmental remodeling of the retinogeniculate synapse. Neuron 28: 955-966. - PubMed
    1. Enroth-Cugell C, Robson JG (1966) The contrast sensitivity of retinal ganglion cells of the cat. J Physiol (Lond) 187: 517-552. - PMC - PubMed

Publication types

MeSH terms

Substances