. 2004 Sep 29;24(39):8551-61.
doi: 10.1523/JNEUROSCI.0919-04.2004.

Superlinear population encoding of dynamic hand trajectory in primary motor cortex

Affiliations

Superlinear population encoding of dynamic hand trajectory in primary motor cortex

Liam Paninski et al. J Neurosci. .

Abstract

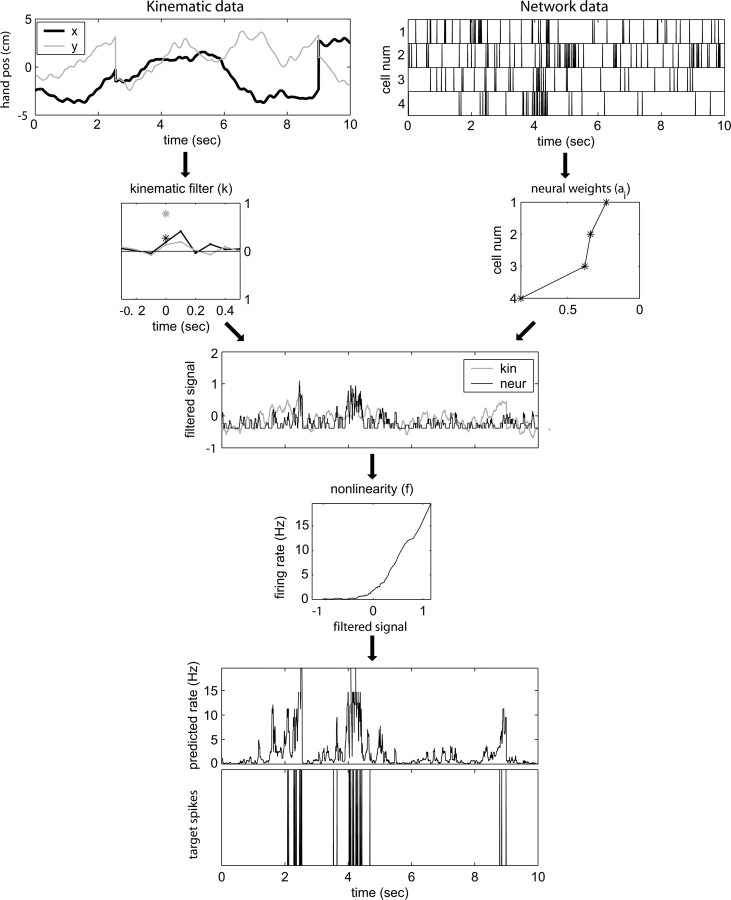
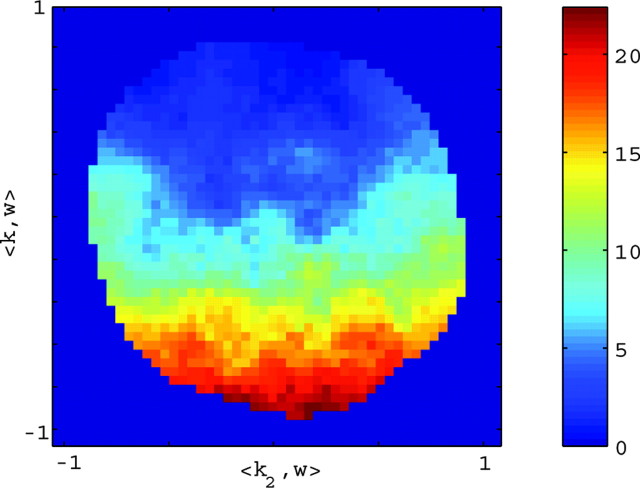
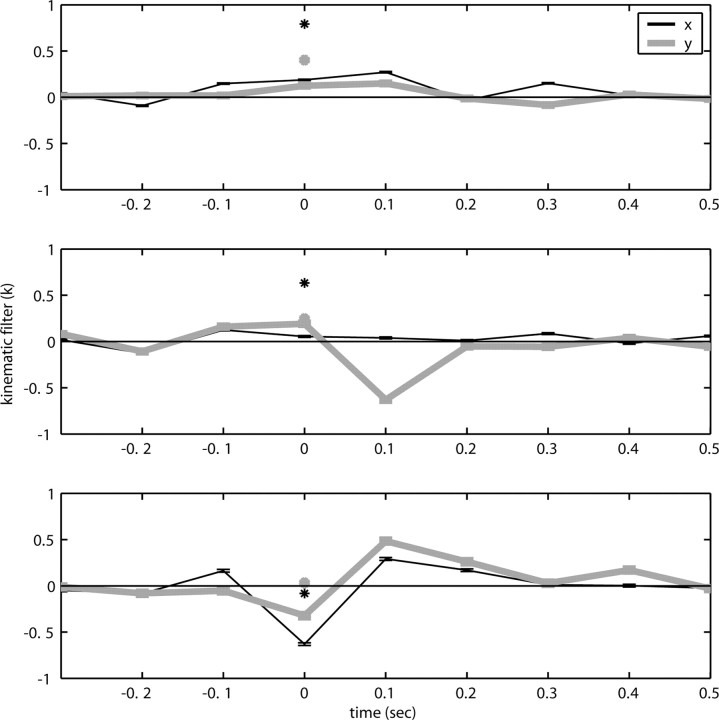
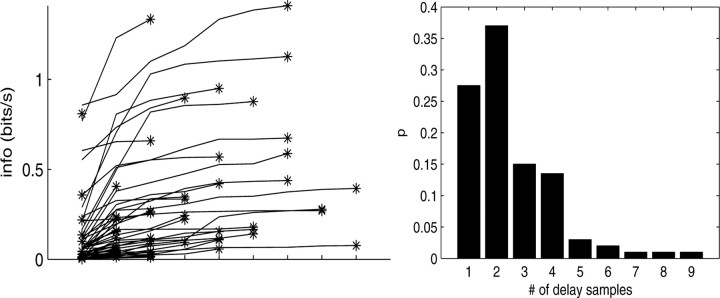
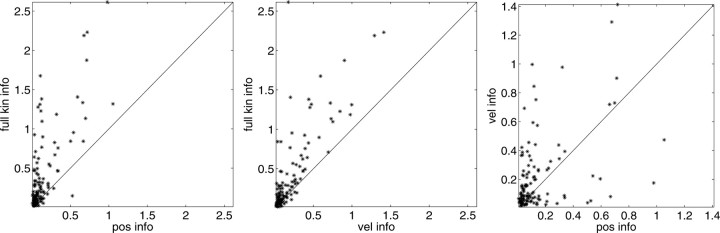
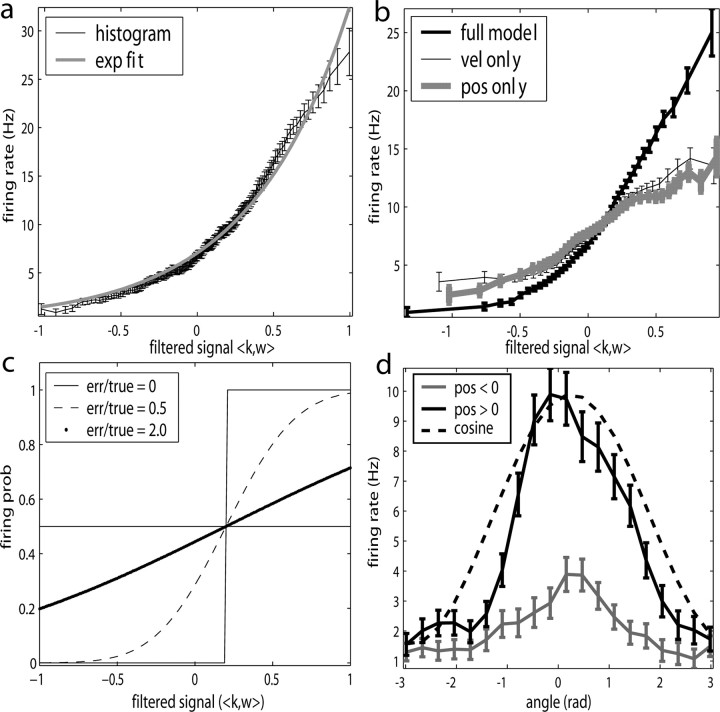
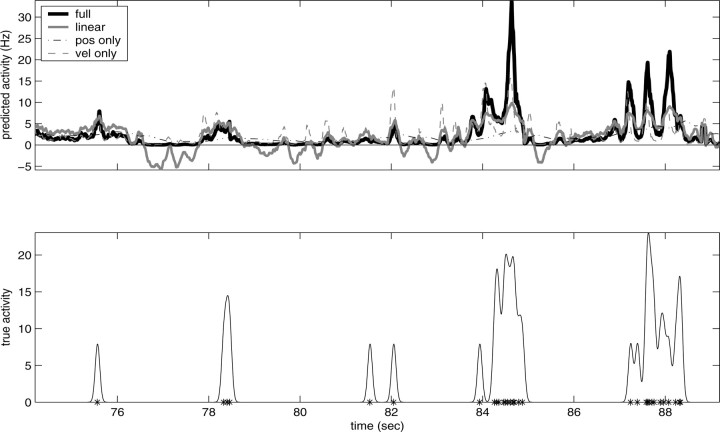
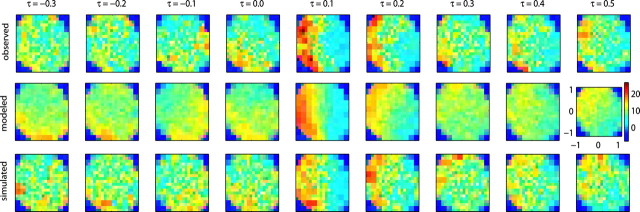
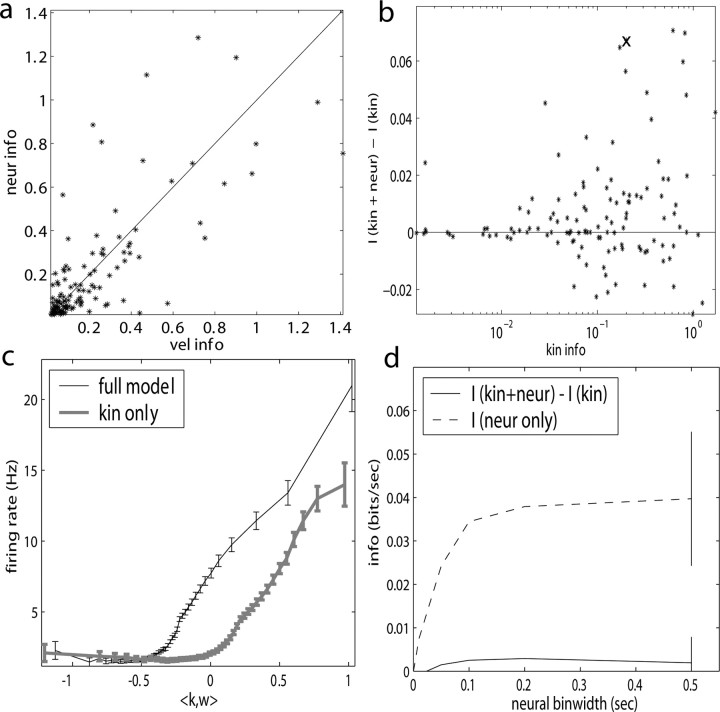
Neural activity in primary motor cortex (MI) is known to correlate with hand position and velocity. Previous descriptions of this tuning have (1) been linear in position or velocity, (2) depended only instantaneously on these signals, and/or (3) not incorporated the effects of interneuronal dependencies on firing rate. We show here that many MI cells encode a superlinear function of the full time-varying hand trajectory. Approximately 20% of MI cells carry information in the hand trajectory beyond just the position, velocity, and acceleration at a single time lag. Moreover, approximately one-third of MI cells encode the trajectory in a significantly superlinear manner; as one consequence, even small position changes can dramatically modulate the gain of the velocity tuning of MI cells, in agreement with recent psychophysical evidence. We introduce a compact nonlinear "preferred trajectory" model that predicts the complex structure of the spatiotemporal tuning functions described in previous work. Finally, observing the activity of neighboring cells in the MI network significantly increases the predictability of the firing rate of a single MI cell; however, we find interneuronal dependencies in MI to be much more locked to external kinematic parameters than those described recently in the hippocampus. Nevertheless, this neighbor activity is approximately as informative as the hand velocity, supporting the view that neural encoding in MI is best understood at a population level.


Figures

Figure 1.
Figure 1.
Predicting MI spike trains from dynamic hand position signals and neighboring neural activity. Top left, Horizontal (x) and vertical (y) hand position as a function of time, formula image. Top right, Raster activity of simultaneously recorded neighbor cells formula image. Hand position signal is linearly filtered by the preferred trajectory formula image (left; see Fig. 2 for conventions), and neighbor cell activities are linearly weighted by weights formula image (right) to produce kinematic and neural filtered signals formula image and formula image,respectively (third row). Filtered signals are summed, then nonlinearly is transformed by f (fourth row) to produce predicted firing rate (fifth row). True observed target spike train shown in bottom. Figures display a randomly chosen segment of experimental data: occasional discontinuities in kinematic signal attributable to breaks between behavioral trials.
Figure 5.
Figure 5.
A single preferred trajectory formula image is sufficient for the representation of the encoding function f. Firing rate of one example cell as a function of two filtered signals, formula image and formula image, with formula image chosen to be the next most informative such filter, restricted to be orthogonal to formula image (see Materials and Methods); y- and x-axes index formula image and formula image, respectively, and color axis indicates the conditional firing rate (in hertz) given these two variables. Contours of firing rate function are approximately linear and perpendicular to the formula image axis: a one-dimensional function formula image captures the relevant structure of the tuning of this neuron (Paninski, 2003a).
Figure 2.
Figure 2.
Diversity of estimated preferred trajectories formula image. Example preferred trajectories formula image, estimated for three different cells. Asterisk indicates contribution of position (in centimeters) at zero time lag, and solid line gives contribution of velocity (in centimeters per second) at the different time lags shown; error bars represent SE. (For why this representation of the preferred trajectory formula image was chosen, see Materials and Methods.)
Figure 4.
Figure 4.
Information captured as a function of number of delay samples. Top, Each trace corresponds to the information versus number of delay samples for a single cell; asterisk denotes optimal number of delays. Only a randomly chosen subsample of cells is shown here, to avoid overcrowding. Bottom, Histogram of minimal number of filter delays per cell necessary to capture information in full preferred trajectory formula image.
Figure 3.
Figure 3.
Scatter plots of information about firing rate from position, versus velocity, versus full filtered signal formula image. Each dot corresponds to the information measured from a single cell (bits per second, measured in 5 msec bins); diagonal line indicates unity. Information estimates in the left and middle panels fall significantly above diagonal, indicating more information provided by optimal formula image than by position or velocity alone. Position was sampled at zero time lag here, with velocity sampled at 100 msec after the current firing rate time bin (lag values chosen to maximize the information values shown; for other time lags, these points tended to fall even farther above the diagonal).
Figure 6.
Figure 6.
Illustration and implications of the nonlinearity of MI cells. a, Example encoding function f (mean ± SE), with corresponding exponential fit. b, Observed encoding function f for filter set to extract optimal formula image, position, or velocity along preferred direction. Tuning becomes sharper (more nonlinear) and observed dynamic range increases as chosen filter becomes closer to optimal formula image. c, Illustration on simulated data of linearization effect on sharpness of nonlinearity. Model cell is perfectly binary, firing with probability one or zero depending on whether formula image is larger or smaller than a threshold value. As the ratio of formula image to formula image becomes larger (i.e., as we project onto an axis that is farther away from the true formula image), the observed nonlinearity becomes shallower and smoother, becoming perfectly flat in the limit as formula image becomes large. d, Dependence of velocity direction tuning curves (expected firing rate as a function of velocity angle) on hand position. Gray curve was computed using only velocities that were observed when hand position was to the left of midline; black curve used only rightward positions. Cosine curve (dashed) shown for comparison; observed tuning is significantly sharper than cosine (one-sided t test).
Figure 7.
Figure 7.
Comparison of firing rate predictions; example of multiplicative gain-modulation effect. Top, Firing rates predicted by full nonlinear kinematic model, best linear model, best nonlinear velocity model, and best nonlinear position model. Bottom, True observed spike train (asterisks) and time-smoothed firing rate (solid). Firing rate smoothed here with a Gaussian kernel for which the width was chosen to approximately match the timescale of firing rate variations in top panel (for straightforward comparisons).
Figure 8.
Figure 8.
Comparison of observed and model spatiotemporal tuning functions. Top, Observed STTF; mean firing rate of a single cell, given the (two-dimensional) velocity τ seconds in the future (Paninski et al., 2004). Middle, Modeled STTF constructed from average firing rate predicted by Model 2. Bottom, Simulated STTF constructed by stochastically sampling spike trains from Model 2.
Figure 9.
Figure 9.
Observing neighbor activity increases the predictability of MI neurons. a, Comparison of information values for neural-only (no kinematic input; formula image) versus velocity-only (no neural input; formula image) models. Conventions as in Figure 2; for fair comparison, information values here are based on the largest bin width shown in d, 500 msec. b, Comparison of information values for full model (kinematic data formula image augmented with neighboring neural activity formula image) versus kinematic-only model (formula image). Significantly more points fall above the equality line (one-sided t test; note logarithmic scale used to expose structure in scatter plot here). c, Estimated encoding functions f for kinematic-only (gray trace) versus full model (black). Note the differences in dynamic range of two curves. Cell illustrated here is marked with an “x” in b. d, Effects of bin width on network informativeness in the presence of kinematic information [formula image nonzero; solid trace is median ± SE information difference formula image over all cells, plotted against bin width used to define ni] and without [dashed trace is formula image, i.e., formula image].

References

    1. Adrian E (1926) The impulses produced by sensory nerve endings. J Physiol (Lond) 61: 49-72. - PMC - PubMed
    1. Amirikian B, Georgopoulos A (2000) Directional tuning profiles of motor cortical cells. Neuroscience Res 36: 73-79. - PubMed
    1. Arieli A, Sterkin A, Grinvald A, Aertsen A (1996) Explanation of the large variability in evoked cortical responses. Science 273: 1868-1871. - PubMed
    1. Ashe J, Georgopoulos A (1994) Movement parameters and neural activity in motor cortex and area 5. Cereb Cortex 4: 590-600. - PubMed
    1. Baker J, Fellows M, Donoghue J (1997) Directional tuning rotations in motor cortical neurons during radial arm movements. Soc Neurosci Abstr 23: 607.2.

Publication types