. 2004 Sep 29;24(39):8606-20.
doi: 10.1523/JNEUROSCI.2660-04.2004.

ATP excites interneurons and astrocytes to increase synaptic inhibition in neuronal networks

Affiliations

ATP excites interneurons and astrocytes to increase synaptic inhibition in neuronal networks

David N Bowser et al. J Neurosci. .

Abstract

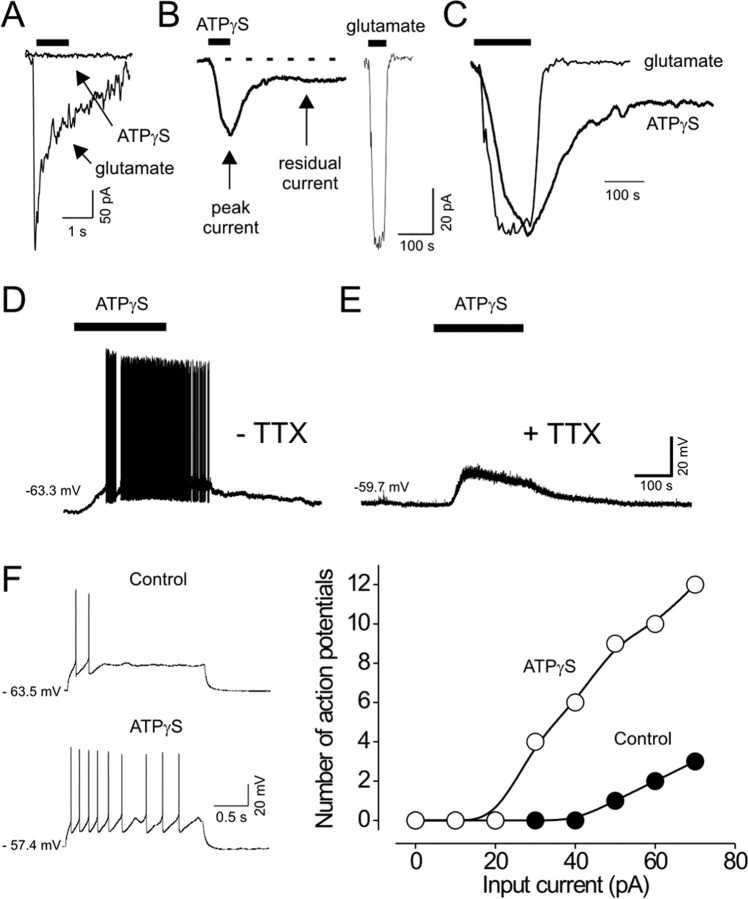
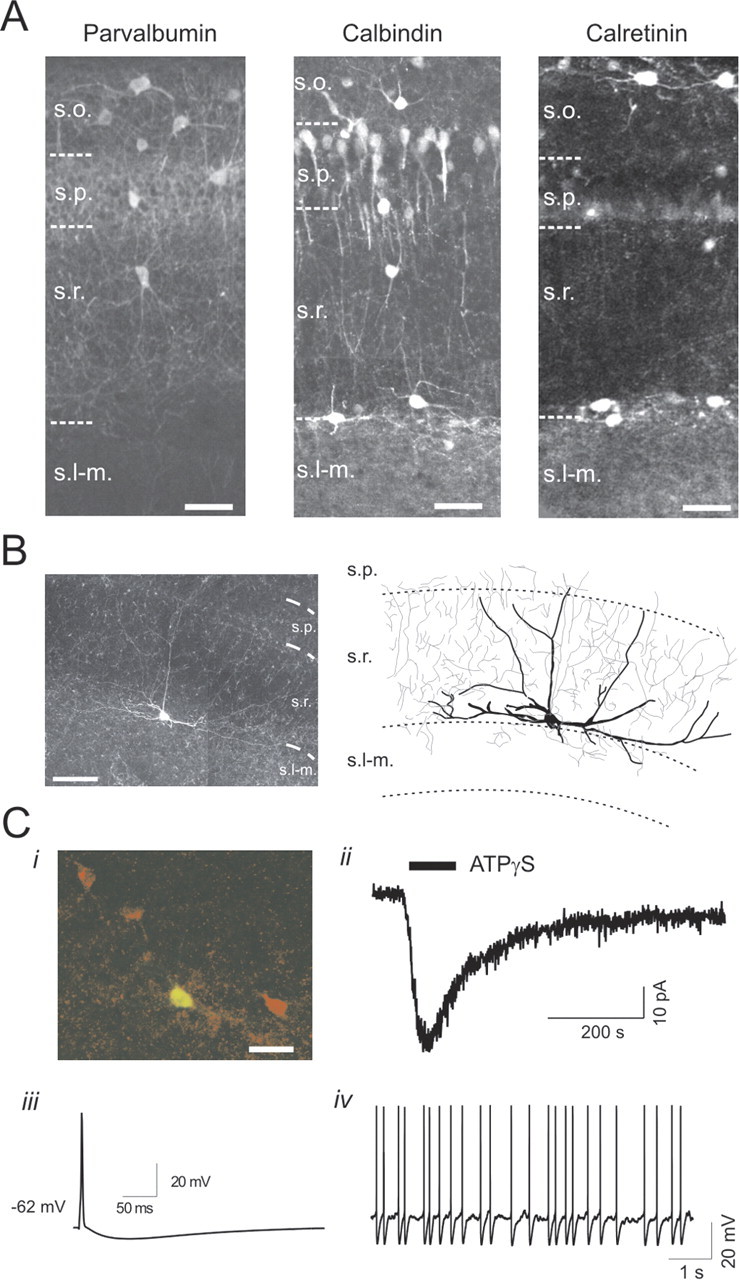
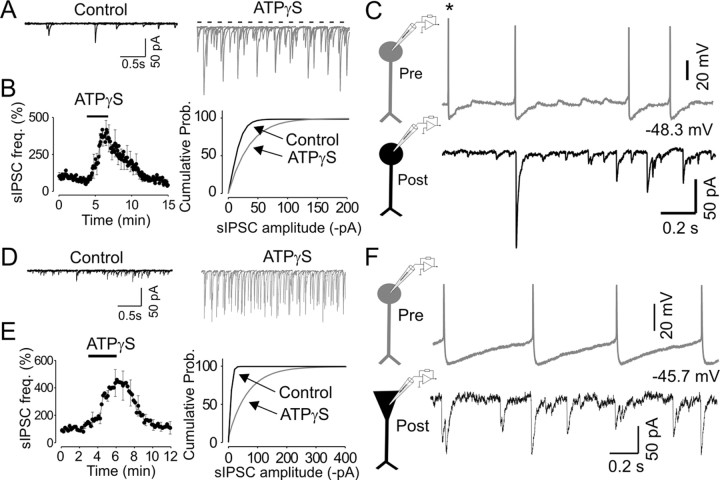
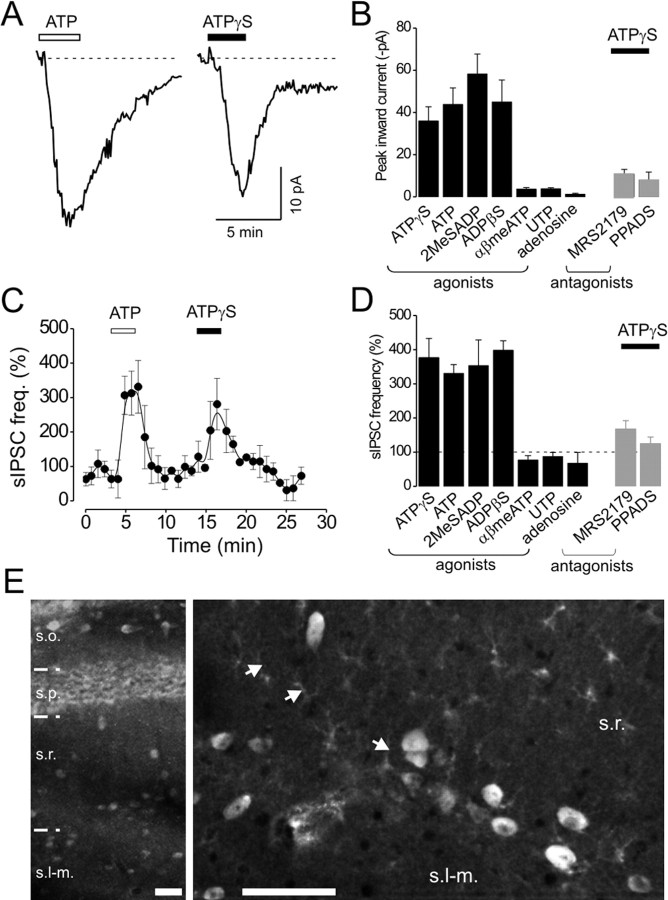
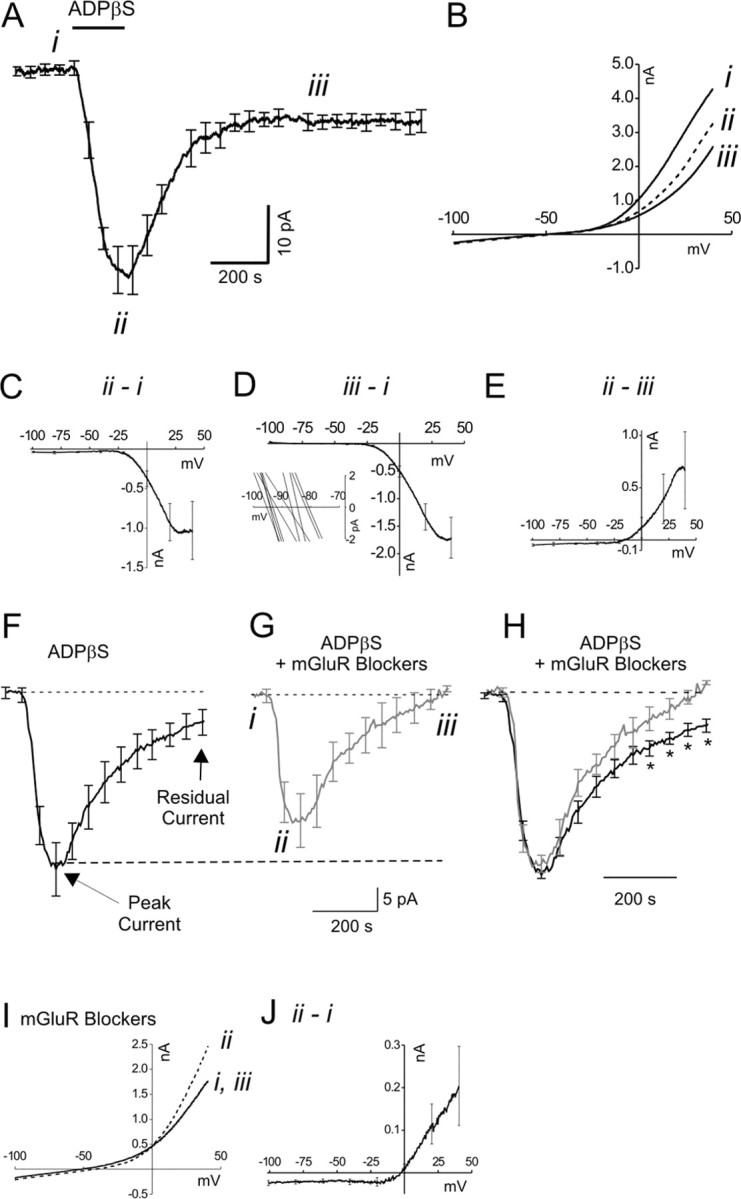
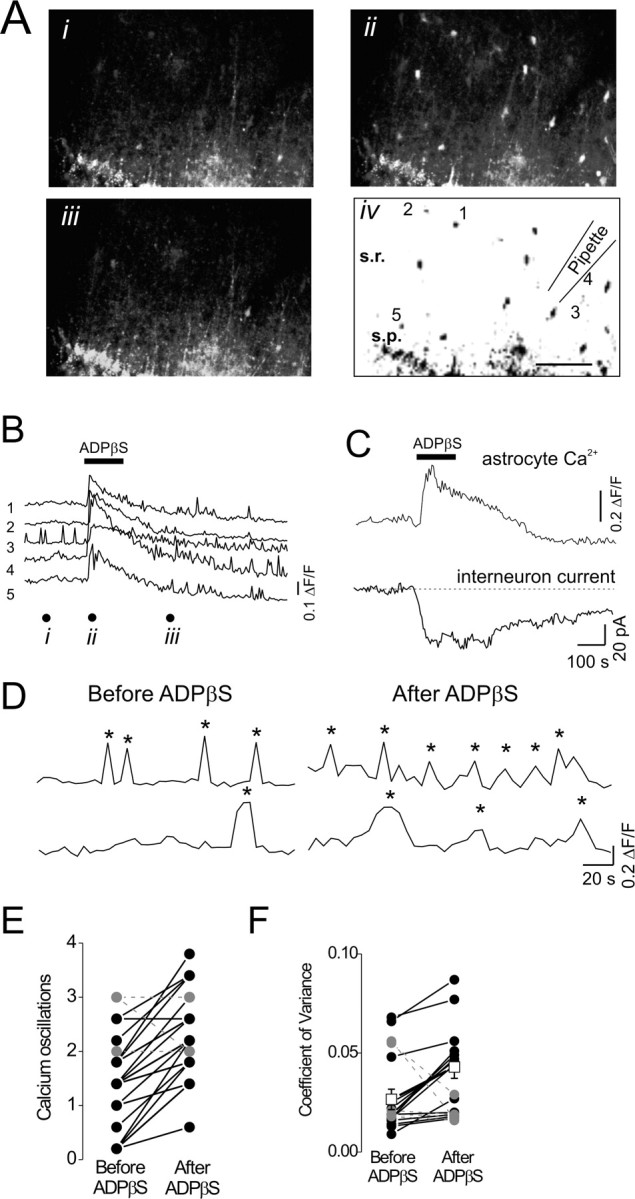
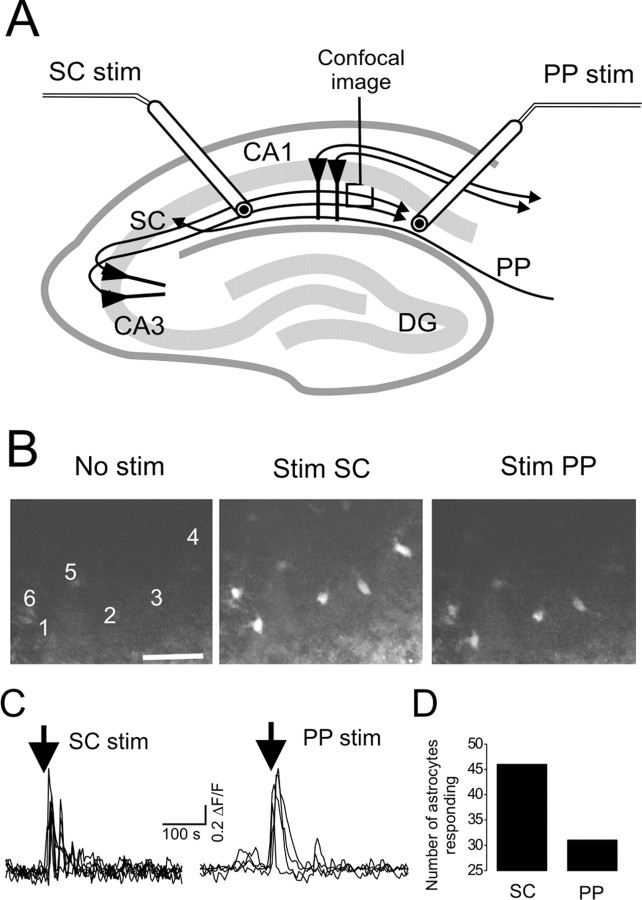
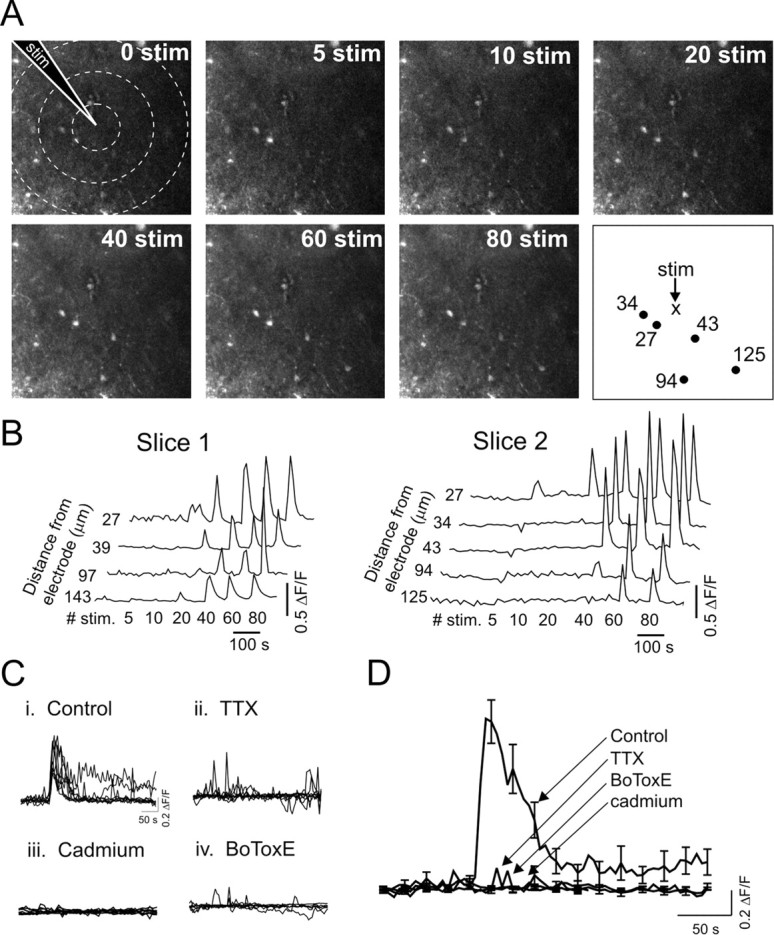
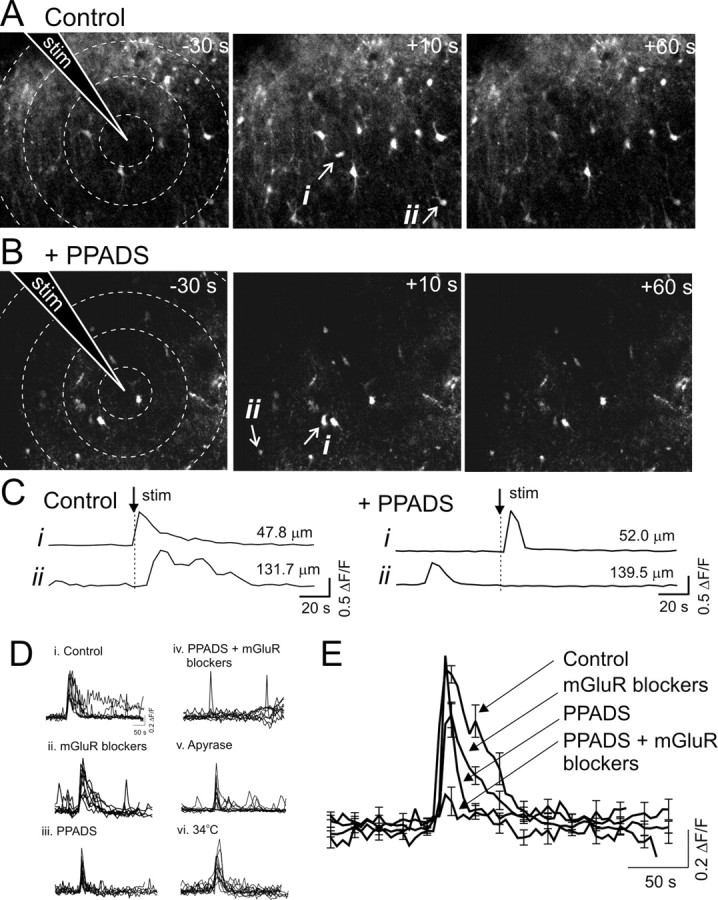
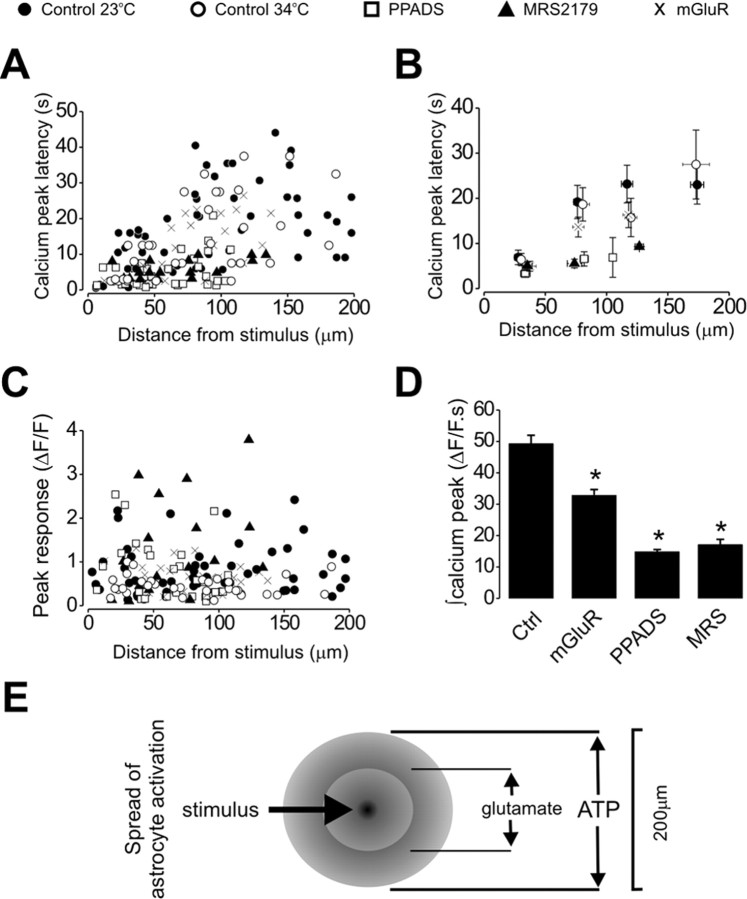
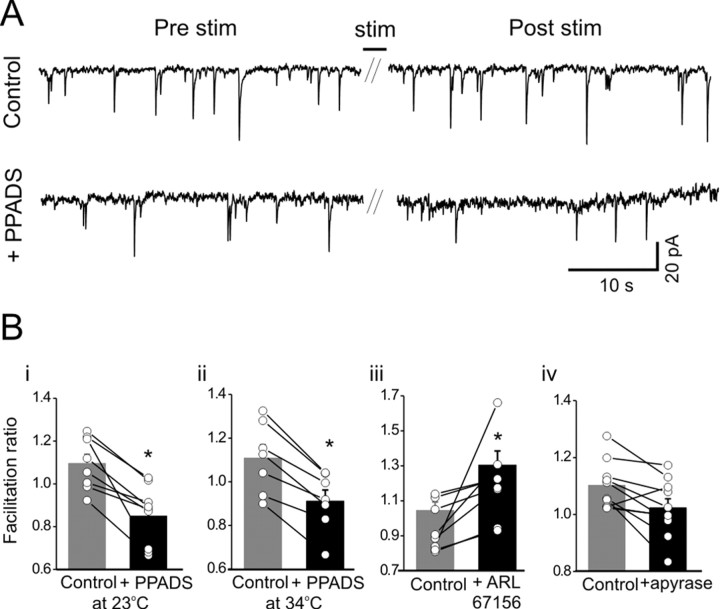
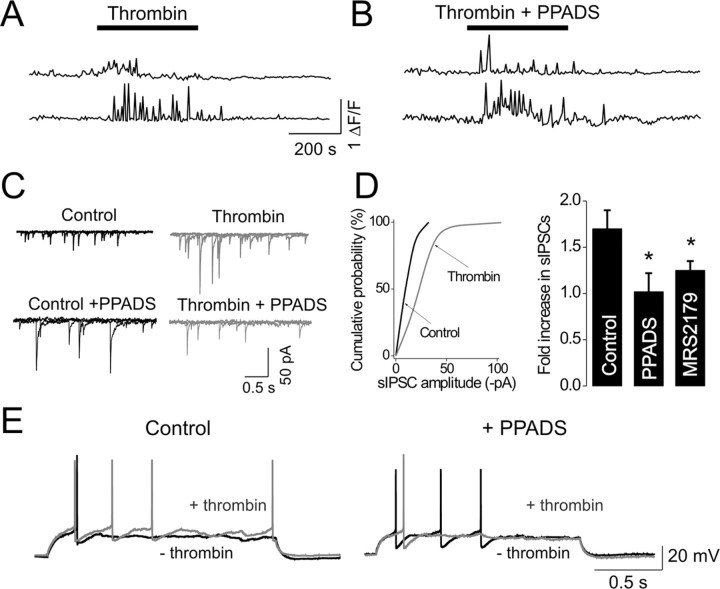
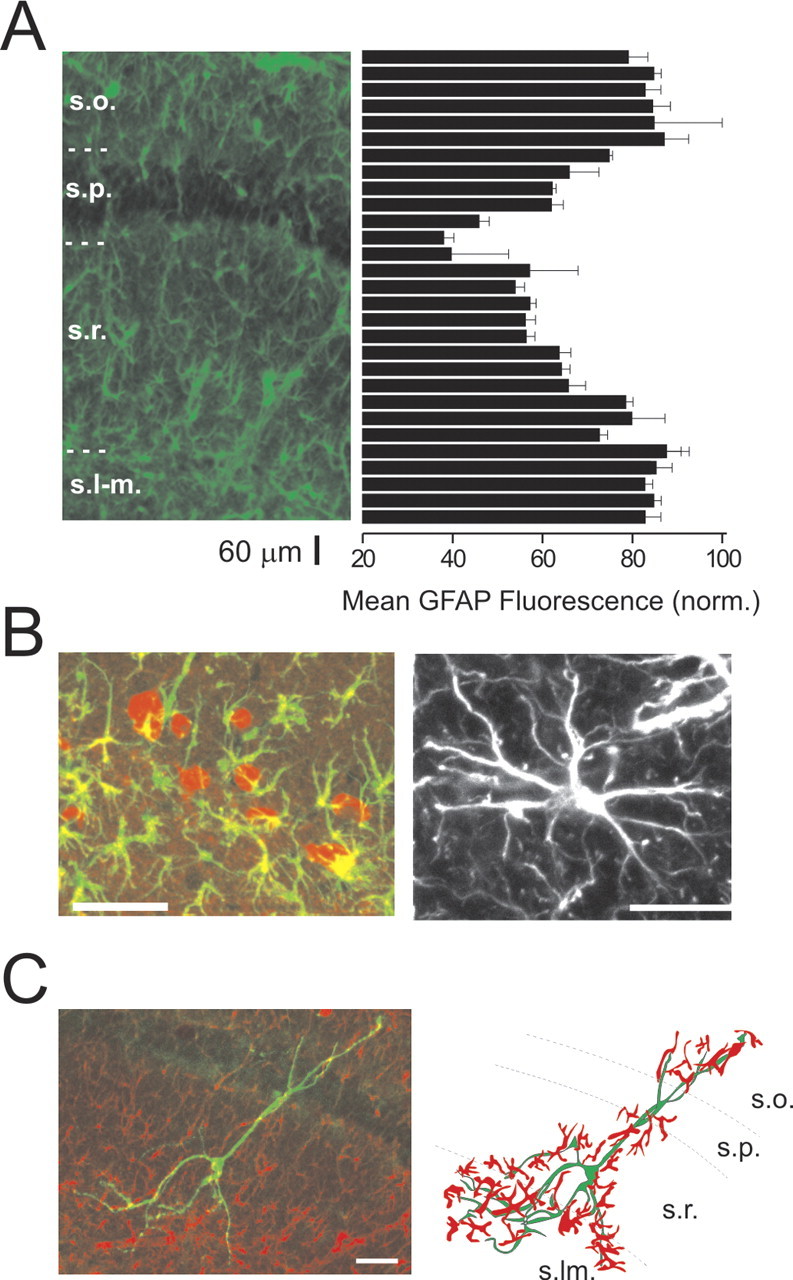
We investigated the role of extracellular ATP at astrocytes and inhibitory GABAergic interneurons in the stratum radiatum area of the mouse hippocampus. We show that exogenously applied ATP increased astrocyte intracellular Ca2+ levels and depolarized all calbindinand calretinin-positive interneurons in the stratum radiatum region of mouse hippocampus, leading to action potential firing and enhanced synaptic inhibition onto the postsynaptic targets of interneurons. Electrophysiological, pharmacological, and immunostaining studies suggested that the effect of ATP on interneurons was mediated by P2Y1 receptors, and that the depolarization of interneurons was caused by the concomitant reduction and activation of potassium and nonselective cationic conductances, respectively. Electrical stimulation of the Schaffer collaterals and perforant path, as well as local stimulation within the stratum radiatum, evoked increases in intracellular Ca2+ in astrocytes. Facilitation of GABAergic IPSCs onto interneurons also occurred during electrical stimulation. Both the stimulation-evoked increases in astrocyte Ca2+ levels and facilitation of GABAergic IPSCs were sensitive to antagonists of P2Y1 receptors and mimicked by exogenous P2Y1 receptor agonists, suggesting that endogenously released ATP can activate P2Y receptors on both astrocytes and interneurons. Overall, our data are consistent with the hypothesis that ATP released from neurons and astrocytes acts on P2Y1 receptors to excite interneurons, resulting in increased synaptic inhibition within intact hippocampal circuits.


Figures

Figure 1.
Figure 1.
Slow ATPγS evoked excitation of interneurons. A, Stratum radiatum interneurons were held in voltage clamp (-60 mV), and ATPγS (100 μm) and glutamate (10 μm) were puffed for 500 msec to the neuron cell body. These recordings were made in a CSF not containing CNQX. B, Bath application of the same concentrations of ATPγS and glutamate in the presence of CNQX (10 μm). C, Normalized ATPγS and glutamate evoked peak currents shown in B. Note the differences in rise and decay times. D, S.r. interneurons depolarized and generated action potentials during bath application of 100 μm ATPγS.E, The action potentials were blocked by 1 μm TTX revealing the underlying ATPγS-evoked depolarization. F, Example traces from an s.r. interneuron held in current clamp with 50 pA of depolarizing current injection before (top trace) and in the presence of ATP γS (bottom trace). The graph on the right shows the number of action potentials generated during each depolarizing current step under control conditions and in the presence of 100 μm ATPγS.
Figure 2.
Figure 2.
Characterization of CA1 s.r.-s.l-m. interneurons. A, Immunofluorescence micrographs of neurons immunoreactive for parvalbumin, calbindin, or calretinin. Scale bar, 50 μm. B, Montage of confocal Z-stacks flattened top resent an overview of a biocytin-filled interneuron reconstructed on the right with predominantly horizontal dendrites (black) and axonal arborization confined to s.r.-s.l-m. (gray) (see supplemental material, available at www.jneurosci.org, cell 6, for additional details of this interneuron). Scale bar, 50 μm. C, Properties of the interneuron presented in B. i, Immunofluorescence image of biocytin (green) and calbindin (red) immunoreactivity, with overlay in yellow. Note that several calbindin-positive interneurons are present in this image. Scale bar, 25 μm. ii, Current in response to 100 μm ATPγS. iii, Action potential generated by a 5 msec currentpulse of + 150 pA. iv, Irregular action potential discharge pattern generated during depolarizing current injection. s.p., Stratum pyramidale.
Figure 3.
Figure 3.
ATP increases synaptic inhibition onto stratum radiatum interneurons and CA1 pyramidal neurons. A, ATPγS caused an inward current as well an increase in the frequency (freq.) and amplitude of spontaneous IPSCs in 21 of 26 interneurons (traces show 3 superimposed 3 sec sweeps). B, Left graph, Average data for changes in sIPSC frequency in the absence of TTX. Right graph, Cumulative probability (Prob.) plots of IPSC amplitude before and during ATPγS. C, The diagram illustrates the recording set up, with one s.r. interneuron as the presynaptic cell held in current clamp and another as the postsynaptic cell held in voltage clamp. Top panel, Membrane potential recording from a presynaptic s.r. interneuron showing spontaneous action potentials during the application of ATPγS. Bottom panel, Membrane current recording from a postsynaptic s.r. interneuron showing IPSCs. D, ATPγS caused no inward current but increased in the frequency and amplitude of sIPSCs in CA1 pyramidal neurons (traces show 3 superimposed 3 sec sweeps). Postsynaptic uIPSCs showed a short latency (2.7 ± 0.1 msec; n = 14 pairs) and displayed 20-80% rise times of 1.7 ± 0.1 msec and decay time constants of 13.4 ± 0.7 msec, respectively (n = 14 pairs). E, Left graph, Average data for changes in sIPSC frequency in the absence of TTX. Right graph, Cumulative probability plots of IPSC amplitude before and during ATPγS. F, The diagram illustrates the recording set up, with an s.r. interneuron as the presynaptic cell held in current clamp and a CA1 pyramidal neuron as the postsynaptic cell held in voltage clamp. Top panel, Membrane potential recording from a presynaptic s.r. interneuron showing spontaneous action potentials during the application of ATPγS. Bottom panel, Membrane current recording from a postsynaptic CA1 pyramidal neuron showing IPSCs. Unitary IPSCs onto pyramidal neurons displayed 20-80% rise times of 1.0 ± 0.2 msec and decay time constants of 11.6 ± 1.1 msec (n = 8 pairs). s.r.-s.p. pairs had an average uIPSC latency of 4.1 ± 0.3 msec in control conditions and 4.2 ± 0.3 msec in ATPγS (n = 5 pairs; Fig. 3g).
Figure 4.
Figure 4.
Pharmacological properties of ATP responses in SR interneurons. A, Exemplar traces showing whole-cell voltage-clamp currents at -60 mV first to a test nucleotide (ATP) and then to ATPγS (100 μm). B, Average data for each test agonist: ATPγS (100 μm; n = 22), ATP (1 mm; pH 7.4; n = 8), 2MeSADP (100 μm; n = 8), ADPβS (100 μm; n = 16), αβmeATP (100 μm; n = 10), UTP (100 μm; n = 11), and adenosine (100 μm; n = 7). Data are also shown for ATPγS-evoked currents in slices incubated in MRS2179 (30 μm; n = 19) and PPADS (10 μm; n = 6). C, Spontaneous IPSCs were recorded in voltage-clamp mode at -60 mV (KCl intracellular solution) first to a test nucleotide agonist and then to test ATPγS. An example experiment is shown in C where the frequency of sIPSCs is normalized to baseline. D shows the average peak sIPSC frequency increase for each agonist tested: ATPγS (100 μm; n = 21), ATP (1 mm; pH 7.4; n = 5), 2MeSADP (100 μm; n = 7), ADPβS (100 μm; n = 16), αβmeATP (100 μm; n = 8), UTP(100 μm;n = 11), and adenosine (100 μm; n =6). Data are also shown for ATP γS-induced responses in slices incubated in MRS2179 (30 μm; n = 9) and PPADS (10 μm; n = 11). The asterisk indicates significant responses. E, Confocal images of P2Y1 expressing interneurons in CA1. Scale bar, 50 μm. Note the highly fluorescent distinct somata are confined to interneurons in s.r., s.l-m., and s.o. The more diffuse staining in the pyramidal cell layer is probably not specific and has been observed by others (Matyas et al., 2004).
Figure 5.
Figure 5.
Electrophysiological properties of P2Y1 receptor-mediated inward currents. A, The trace shows average ADPβS-evoked inward currents recorded from interneurons at -60 mV (n = 12). The points i, ii, and iii indicate the time when current-voltage relationships presented in B-E were determined. Current-voltage (I-V) relationships were determined using voltage ramps from -100 to +40mV (9.3 mV/sec) before (i), at the peak of the ATP γS current (ii), and after washout of ATPγS(iii) as indicated in A. The resulting I-V relationships for a single experiment are shown in B. Subtraction of I-V relationships indicates the average I-V relationships of the peak and residual currents (n = 10; C-E). Inset in D is an expanded I-V region from -100 to -80 mV to show reversal potentials for each individual neuron. F, Average ADPβS-evoked currents recorded from interneurons under control conditions (F) and then in the presence of group I mGluR antagonists MPEP and LY367385 (100 μm; G). The points i, ii, and iii in G indicate where current-voltage relationships presented inI and J were determined. H, Normalized traces shown inF and G. I, Current-voltage relationships from ramps for an ADPβS-evoked current in the presence of mGluR blockers. J, Subtraction of I-V relationships at i and ii indicates the average I-V relationship of the peak current, with reversal of the current close to 0 mV (n = 8).
Figure 6.
Figure 6.
Astrocyte Ca2+ dynamics. A, Fluorescence micrographs of an acute hippocampal slice loaded with fluo-4-AM (see Materials and Methods) before (i), during (ii), and after (iii) ADPβS. iv indicates the location of the astrocytes that were monitored (numbered 1-5) and hippocampal cell layers as well as the location of the recording pipette (the patched interneuron was below the confocal section). Scale bar, 50 μm. B, Traces showing changes in intracellular Ca2+ for five representative astrocytes indicated in the panels in A. C, Average fluorescence trace from nine astrocytes and the corresponding interneuron current in this experiment. D, Traces showing spontaneous Ca2+ oscillations before and after ADP βS for two astrocytes on an expanded time scale. The asterisk indicates a transient peak in intracellular Ca2+ concentration. E, Number of oscillations in the 200 sec before and 200 sec after ADPβS for 33 astrocytes. F, Coefficient of variance was also measured before and after ADPβS as a measure of astrocyte activity. In F, astrocytes with increased oscillations are shown in black, and those with decreased oscillations are shown in gray.
Figure 7.
Figure 7.
Astrocyte activation by stimulation (stim) of the Schaffer collaterals and the peforant path. A, Schematic diagram of the hippocampus showing glutamatergic SC and PP axons. A concentric wire electrode was placed in stratum radiatum to stimulate SC or PP axons as indicated, whereas Ca2+ transients were recorded in astrocytes. B, Fluorescence micrographs of fluo-4-loaded astrocytes in s.r. without stimuli, with SC stimuli, and with PP stimuli. Numbers in the left panel indicate astrocytes monitored to obtain recordings shown below in C. D, Bar graph indicating number of astrocytes that responded to SC and PP stimulation from eight slices.
Figure 8.
Figure 8.
Astrocytes are activated by vesicular release during local electrical stimulation. A, Confocal images of fluo-4-loaded astrocytes in hippocampal slices. A glass electrode is placed in the center of the field of view (stim), and trains of stimuli (number indicated on image) are delivered to the slice at 30 Hz. The concentric circles are 50 μm apart. The final panel identifies astrocytes monitored and the number of micrometers they are from the electrode. Astrocytes appear to be confined to the bottom left of the image as the confocal section is taken across an uneven hippocampal slice where fluo-4 loading is often confined to superficial astrocytes. B, Representative recordings of astrocyte Ca2+ transients from two slices with increasing numbers of electrical stimuli. The calcium transients in astrocytes of slice 2 are from the experiment presented in A. C, Ten superimposed traces showing the change in intracellular Ca2+ for astrocytes under control conditions (i) and in the presence of 1 μm TTX (ii), 10 μm cadmium (iii), and 20 μg/ml botulinum toxin E (iv). D, Average traces for treatments indicated in C (TTX: n = 36, 9 slices; cadmium: n = 46, 6 slices; botulinum toxin E: n = 35, 5 slices).
Figure 9.
Figure 9.
Astrocyte Ca2+ transients evoked by electrical stimulation (stim). A, B, Confocal images of fluo-4-AM-loaded hippocampal slices 30 sec before field stimulation and 10 and 30 sec after stimulation under control conditions (A) and in the presence of 30 μm PPADS (B). The position of the stimulating electrode is shown on a grid of 25 μm spacing. C, Example Ca2+ traces for two astrocytes (i, ii indicated in A, B) and the distances from the stimulating electrode under control conditions and in the presence of PPADS. D, Ten superimposed traces showing change in intracellular Ca2+ for astrocytes in control (i), in the presence of mGluR antagonists (ii), PPADS (iii), and both mGluR antagonists and PPADS (iv). Note that the transients are briefer in the presence of PPADS and completely blocked in the presence of both PPADS and the mGluR antagonists. Superimposed traces are also shown for slices treated with 20 U/ml apyrase (v) and for experiments conducted at 34°C (vi). Average astrocyte transients for the indicated treatments are shown in E.
Figure 10.
Figure 10.
Properties of astrocyte Ca2+ transients evoked by electrical stimulation. Pooled astrocyte data for control (9 slices, 54 astrocytes), PPADS treated (9 slices, 29 astrocytes), MRS2179 treated (4 slices, 17 astrocytes), mGluR antagonist treated (7 slices, 41 astrocytes), and control experiments conducted at 34°C (6 slices, 34 astrocytes). A, Scatter plot of calcium peak response latency (time from beginning of spike train to peak of Ca2+ transient) against distance from stimulus region. B, Averaged data for 50 μm bins. C, Peak astrocyte ΔF/F against distance from stimulus region. D, Integrated astrocyte responses evoked by electrical stimulation. E, Summary diagram of the results shown in A-E. In control slices, astrocytes within a radius of 200 μm show an increase in Ca2+ during electrical stimulation; however, when P2Y receptors were blocked, this radius was reduced to 100 μm, implying that endogenously released ATP activates P2Y receptors to allow astrocyte excitation to spread to large distance scales.
Figure 11.
Figure 11.
Electrical stimulation increases GABAergic sIPSCs onto interneurons. A, Interneurons were voltage clamped at -60mV with a KCl-based internal solution allowing visualization of inward GABAergic synaptic events. A train of 100 pulses (7-15 μA; indicated by the gap in the trace) at 30 Hz was applied from a monopolar electrode. A representative trace is shown in A where the bar indicates the stimuli and 30 sec of IPSCs are shown before (Pre stim) and after (Post stim) the stimulus. The slice was then perfused with 30 μm PPADS for 15 min, and the protocol was repeated. The number of IPSCs in 30 sec windows after the train divided by the number before the train is given as the facilitation ratio in B, which was decreased in PPADS at 23°C, PPADS at 34°C, and in the presence of 20 U/ml apyrase at 34°C. Treatment with the ecto-nucleotidase inhibitor ARL67156 at 34°C significantly enhanced the facilitation ratio.
Figure 12.
Figure 12.
Direct astrocyte activation with thrombin increases GABAergic sIPSCs onto interneurons. Two examples of thrombin (10 U/ml) induced Ca2+ oscillations in astrocytes under control conditions (A) and in the presence of PPADS (B). C, Representative current traces of spontaneous IPSCs before and during thrombin perfusion (3 superimposed traces of 3 sec duration). Bottom traces are from a slice incubated in PPADS before and in the presence of thrombin. D, Left graph, Cumulative probability plot of sIPSC amplitude in control conditions and during thrombin. Right, Fold increase in the frequency of sIPSCs evoked by thrombin alone (control; n = 8) or with thrombin in the presence of PPADS (n = 7) or MRS2179 (n = 5). E, Left, Example traces from an s.r. interneuron before and during thrombin. Note that there are more action potentials in thrombin. Right, Example traces from an s.r. interneuron before and during thrombin with PPADS present throughout. Note that there are fewer action potentials in thrombin when PPADS is present (see Results for additional details).
Figure 13.
Figure 13.
Relationship between astrocytes and interneurons. A, Fluorescence micrograph of GFAP-labeled astrocytes (green) reveals that astrocytes are most abundant in s.o., s.r., and s.l-m. Scale bar, 30 μm. The distribution of GFAP fluorescence was quantified in 15-μm-thick regions of interest oriented horizontally across the image. The average intensity from these regions from five different hippocampal sections was normalized (norm.) to the maximum intensity for each slice and plotted as a bar graph on the right. B, Higher-magnification image of P2Y1-labeled interneurons (red) on the s.r.-s.l-m. border with surrounding GFAP-labeled astrocyte processes (green). Scale bar, 30 μm. Left, A confocal image of a GFAP-labeled astrocyte at high magnification. Scale bar, 15 μm. C, Confocal image of a biocytin-filled interneuron (green) with GFAP-immunoreactive astrocytes (red). This interneuron was sketched on the right from a confocal Z-stack of images. GFAP-labeled astrocytes that made contact with the interneuron were traced in red. Scale bar, 50 μm. s.p., Stratum pyramidale.

References

    1. Araque A, Carmignoto G, Haydon PG (2001) Dynamic signalling between astrocytes and neurons. Annu Rev Physiol 63: 795-813. - PubMed
    1. Bertrand S, Lacaille JC (2001) Unitary synaptic currents between lacunosum-moleculare interneurones and pyramidal cells in rat hippocampus. J Physiol (Lond) 532: 369-384. - PMC - PubMed
    1. Braun N, Zhu Y, Krieglstein J, Culmsee C, Zimmermann H (1998) Upregulation of the enzyme chain hydrolyzing extracellular ATP after transient forebrain ischemia in the rat. J Neurosci 18: 4891-4900. - PMC - PubMed
    1. Burnstock G (1972) Purinergic nerves. Pharmacol Rev 24: 509-581. - PubMed
    1. Burnstock G (2004) Cotransmission. Curr Opin Pharmacol 4: 47-52. - PubMed

Publication types

MeSH terms

LinkOut - more resources