. 2004 Oct;24(20):8862-71.
doi: 10.1128/MCB.24.20.8862-8871.2004.

Severe global DNA hypomethylation blocks differentiation and induces histone hyperacetylation in embryonic stem cells

Affiliations

Severe global DNA hypomethylation blocks differentiation and induces histone hyperacetylation in embryonic stem cells

Melany Jackson et al. Mol Cell Biol. 2004 Oct.

Abstract

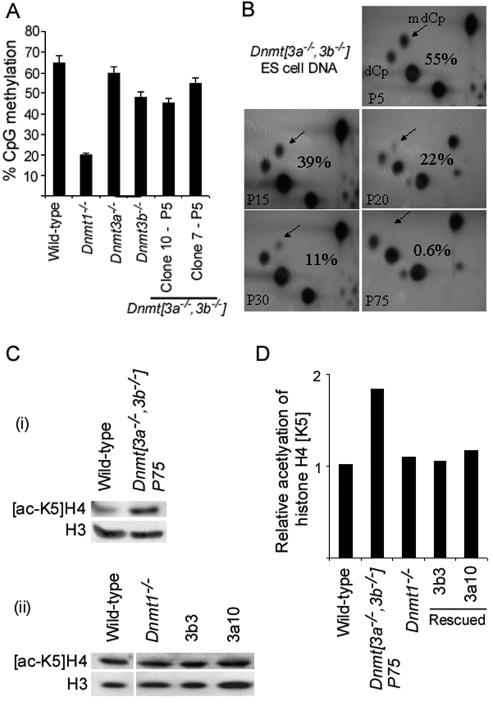
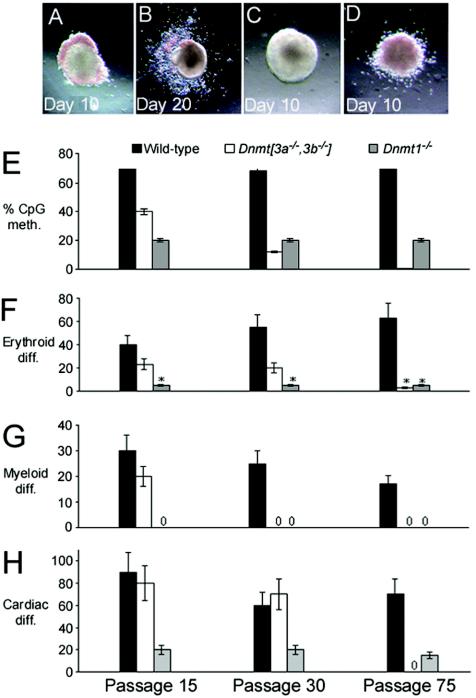
It has been reported that DNA methyltransferase 1-deficient (Dnmt1-/-) embryonic stem (ES) cells are hypomethylated (20% CpG methylation) and die through apoptosis when induced to differentiate. Here, we show that Dnmt[3a-/-,3b-/-] ES cells with just 0.6% of their CpG dinucleotides behave differently: the majority of cells within the culture are partially or completely blocked in their ability to initiate differentiation, remaining viable while retaining the stem cell characteristics of alkaline phosphatase and Oct4 expression. Restoration of DNA methylation levels rescues these defects. Severely hypomethylated Dnmt[3a-/-,3b-/-] ES cells have increased histone acetylation levels, and those cells that can differentiate aberrantly express extraembryonic markers of differentiation. Dnmt[3a-/-,3b-/-] ES cells with >10% CpG methylation are able to terminally differentiate, whereas Dnmt1-/- ES cells with 20% of the CpG methylated cannot differentiate. This demonstrates that successful terminal differentiation is not dependent simply on adequate methylation levels. There is an absolute requirement that the methylation be delivered by the maintenance enzyme Dnmt1.


Figures

FIG. 1.
FIG. 1.
(A) Percent CpG methylation in the indicated ES cell lines as determined by nearest-neighbor analysis. The error bars indicate standard deviations. (B) Percent CpG methylation levels fall in Dnmt[3a−/−,3b−/−] ES cells with continued culture. The relative intensities of the dCp and mdCP spots reflect the frequencies CpG and mCpG at MboI sites. (C) Histone H4 lysine-5 acetylation ([acetyl-K5]H4) levels are increased in Dnmt[3a−/−,3b−/−] P75 ES cells and restored in Dnmt3a and Dnmt3b cDNA-rescued Dnmt[3a−/−,3b−/−] P75 ES cell lines. Acetylation levels are not appreciably increased in Dnmt1−/− ES cells. Separate experiments showing (i) [acetyl-K5]H4 ([ac-K5]H4) levels in Dnmt[3a−/−,3b−/−] P75 ES cells compared with wild-type cells (total H3 serves as a loading control) and (ii) [acetyl-K5]H4 levels in Dnmt1−/− ES cells and the rescued Dnmt[3a−/−,3b−/−] cell lines 3b3 and 3a10 compared with wild-type ES cells. (D) Relative [acetyl-K5]H4 calculated by densitometry after normalization to a total histone H3 loading control.
FIG. 2.
FIG. 2.
Dnmt[3a−/−,3b−/−] ES cells lose differentiation capacities with prolonged passage and progressive demethylation. Photomicrographs of normal erythroid (day 10) (A) and myeloid (day 20) (B) differentiation of wild-type ES cell colonies. Examples of absent (C) and atypical (diffuse low-level) (D) erythroid differentiation are also shown. Bar charts depicting the extent of DNA methylation (meth.) (E), percentage of colonies showing erythroid differentiation (diff.) (F), myeloid differentiation (G), and EBs showing cardiomyocyte differentiation (H) are shown for wild-type, Dnmt1−/−, and Dnmt[3a/,3b−/−] ES cells of different passages. The x axis labels shown in panel H are the same for all graphs. The error bars indicate standard deviations. Asterisks indicate a low level of diffuse hemoglobinization.
FIG. 3.
FIG. 3.
Differentiation is restored by random integration of Dnmt3a and Dnmt3b expression vectors into the Dnmt[3a−/−,3b−/−] P75 ES genome. Nearest-neighbor analysis shows the extent of CpG methylation (meth.) in Dnmt3a-rescued (3a4, 3a10, and 3a16) and Dnmt3b-rescued (3b3, 3b17, and 3b23) clones and a mock-rescued clone 1 (A). The percentages of colonies showing erythroid differentiation (diff.) (B) and myeloid differentiation (C) and the percentage of EBs showing cardiomyocyte differentiation (D) are shown. The x axis labels shown in Fig. 3D are the same for all graphs. The error bars indicate standard deviations. ND, not determined. *, occasional beating seen after 15 days.
FIG. 4.
FIG. 4.
Quantification of alkaline phosphatase-positive undifferentiated ES cells remaining in day 15 EBs by colony assay in 100 U of LIF/ml. The error bars indicate standard deviations.
FIG. 5.
FIG. 5.
Hypomethylated Dnmt[3a−/−,3b−/−] P75 ES cells fail to initiate differentiation upon LIF withdrawal. ES cells were cultured either with LIF (100 U/ml) or without LIF before being replated at low density into 100 or 0 U of LIF/ml. (A) Alkaline phosphatase staining of colonies previously cultured in LIF (100 U/ml) and replated into 0 U of LIF/ml. (B) Percentages of stem cell (black), mixed (grey), and differentiated (white) colonies observed in panel A. (C) ES cell colonies recovered (100 U of LIF/ml; alkaline phosphatase stain) after growth with and without LIF for 7 days. (D) Total numbers of stem cell (black), mixed (grey), and differentiated (white) colonies recovered after 7 days without LIF. (E) Oct4 and SHP2 Western blot of ES cells grown in 100 or 0 U of LIF/ml for 7 days.
FIG. 6.
FIG. 6.
Deregulated mRNA and protein expression is evident in Dnmt[3a−/−,3b−/−] P75 ES cells. (A) Dnmt[3a−/−,3b−/−] P75 ES cells and wild-type and 3b3 rescued ES cells cultured in 100 U of LIF/ml and stained for alkaline phosphatase (Alk. Phos.), laminin B1, and Oct4 by immunocytochemistry. Ab, antibody. (B) RT-PCR analysis of Oct4, Xist, and Gapdh in wild-type, Dnmt[3a−/−,3b−/−] P75, and Dnmt1−/− EBs after induction to differentiate by LIF withdrawal. diff., differentiation. (C) RT-PCR analysis of trophoblast (Tpbp; Pl-1), endoderm (Hnf4a; albumin), mesoderm (brachyury; βh1 globin and α-globin), and housekeeping (Hprt and β-tubulin) genes in differentiating EBs generated from wild-type, Dnmt[3a−/−,3b−/−] P75, and Dnmt1−/− ES cells.
FIG. 7.
FIG. 7.
DNA hypomethylation exacerbates the toxic effects of histone deacetylase inhibition upon differentiation induction. (A) Western blot of ES cell lysates probed with anti-[acetyl-K5]H4. Time course to show the return of acetylation levels to baseline 0, 1.5, and 3.5 h after an 8-h treatment with 50 mM sodium butyrate. (B) Effect on ES cell differentiation of pretreatment with either 50 mM sodium butyrate (pBut) or 160 nM trichostatin A (pTSA). (C) Effect of pretreatment with TSA on the differentiation of Dnmt[3a−/−,3b−/−] P75 ES cell colonies after LIF withdrawal (i) without TSA pretreatment and (ii) with TSA (160 nM) pretreatment. ES colonies were stained for alkaline phosphatase (red).

References

    1. Abe, K., H. Niwa, K. Iwase, M. Takiguchi, M. Mori, S. I. Abe, and K. I. Yamamura. 1996. Endoderm-specific gene expression in embryonic stem cells differentiated to embryoid bodies. Exp. Cell Res. 229:27-34. - PubMed
    1. Cameron, E. E., K. E. Bachman, S. Myohanen, J. G. Herman, and S. B. Baylin. 1999. Synergy of demethylation and histone deacetylase inhibition in the re-expression of genes silenced in cancer. Nat. Genet. 21:103-107. - PubMed
    1. Carlson, L. L., A. W. Page, and T. H. Bestor. 1992. Properties and localisation of DNA methyltransferase in pre-implantation mouse embryos: implications for genomic imprinting. Genes Dev. 6:2536-2541. - PubMed
    1. Chen, T., Y. Ueda, J. E. Dodge, J. Wang, and E. Li. 2003. Establishment and maintenance of genomic methylation patterns in mouse embryonic stem cells by Dnmt3a and Dnmt3b. Mol. Cell. Biol. 23:5594-5605. - PMC - PubMed
    1. Darnell, J. E., Jr. 1997. STATs and gene regulation. Science 277:1630-1635. - PubMed

Publication types

MeSH terms