

On modeling locus heterogeneity using mixture distributions
- PMID: 15458576
- PMCID: PMC524512
- DOI: 10.1186/1471-2156-5-29
On modeling locus heterogeneity using mixture distributions
Abstract
Background: Locus heterogeneity poses a major difficulty in mapping genes that influence complex genetic traits. A widely used approach to deal with this problem involves modeling linkage data in terms of finite mixture distributions. In its simplest setup, also known as the admixture approach, a single parameter is used to model the probability that the disease-causing gene of a family is linked to a reference marker. This parameter is usually interpreted as the overall proportion of linked families.
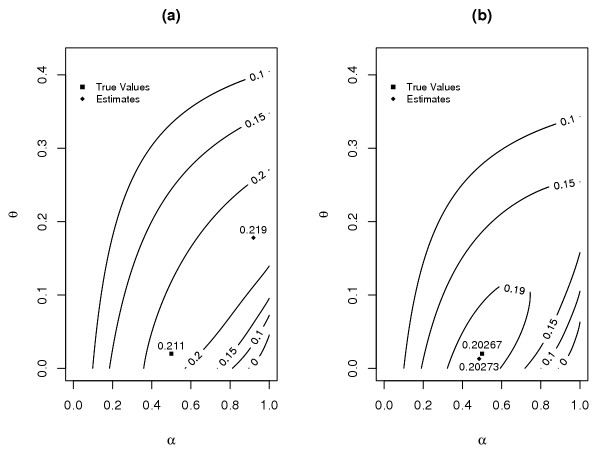
Results: In this article, we address two issues regarding the admixture approach. First, we tackle the question of whether the single parameter of linked proportion is well defined in general. By formulating the likelihood under a classification scheme based on distributions, we show that such a parameter is meaningful only when a certain well-characterized condition is met. Second, we study a condition given in the literature for validating the admixture approach. A counter example is constructed to illustrate that the condition does not necessarily lead to valid estimates.
Conclusions: Estimators from the admixture approach may be inconsistent. This holds even if a condition given in the literature to validate the approach is satisfied.
Figures
Similar articles
-
Incorporating covariates in mapping heterogeneous traits: a hierarchical model using empirical Bayes estimation.Genet Epidemiol. 2007 Nov;31(7):684-96. doi: 10.1002/gepi.20233. Genet Epidemiol. 2007. PMID: 17487892
-
Evaluations of maximization procedures for estimating linkage parameters under heterogeneity.Genet Epidemiol. 2004 Apr;26(3):206-17. doi: 10.1002/gepi.10314. Genet Epidemiol. 2004. PMID: 15022207
-
MCMC-based linkage analysis for complex traits on general pedigrees: multipoint analysis with a two-locus model and a polygenic component.Genet Epidemiol. 2007 Feb;31(2):103-14. doi: 10.1002/gepi.20194. Genet Epidemiol. 2007. PMID: 17123301
-
Replication in genetic studies of complex traits.Ann Hum Genet. 2004 Nov;68(Pt 6):646-57. doi: 10.1046/j.1529-8817.2004.00122.x. Ann Hum Genet. 2004. PMID: 15598223 Review.
-
Mixture distributions in human genetics research.Stat Methods Med Res. 1996 Jun;5(2):155-78. doi: 10.1177/096228029600500204. Stat Methods Med Res. 1996. PMID: 8817796 Review.
Cited by
-
Neural phenotypes of common and rare genetic variants.Biol Psychol. 2008 Sep;79(1):43-57. doi: 10.1016/j.biopsycho.2008.02.005. Epub 2008 Feb 23. Biol Psychol. 2008. PMID: 18395317 Free PMC article. Review.
References
-
- Smith CAB. Testing for heterogeneity of recombination fraction values in human genetics. Ann Hum Genet. 1963;27:175–182. - PubMed
-
- Ott J. Analysis of Human Genetic Linkage. Baltimore: The John Hopkins University Press;; 1999.
-
- Goldin LR. Detection of linkage under heterogeneity. Genet Epidemiol. 1992;9:61–66. - PubMed
Publication types
MeSH terms
Substances
LinkOut - more resources
Full Text Sources
Miscellaneous
