Comparative Study
. 2004 Dec 1;561(Pt 2):485-98.
doi: 10.1113/jphysiol.2004.070490. Epub 2004 Sep 30.

The effect of simulated ischaemia on spontaneous GABA release in area CA1 of the juvenile rat hippocampus

Affiliations
Comparative Study

The effect of simulated ischaemia on spontaneous GABA release in area CA1 of the juvenile rat hippocampus

Nicola J Allen et al. J Physiol. .

Abstract

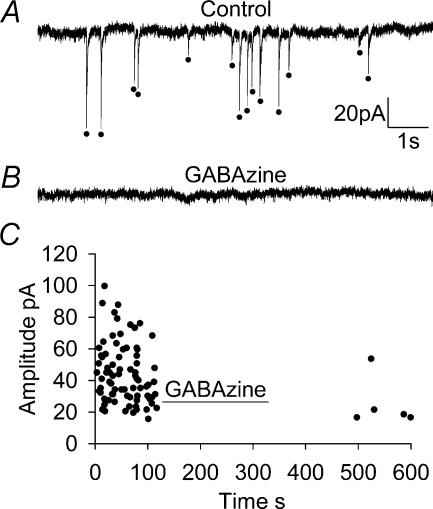
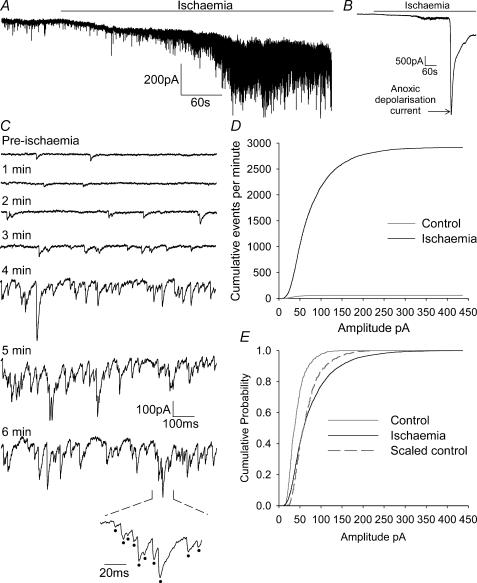
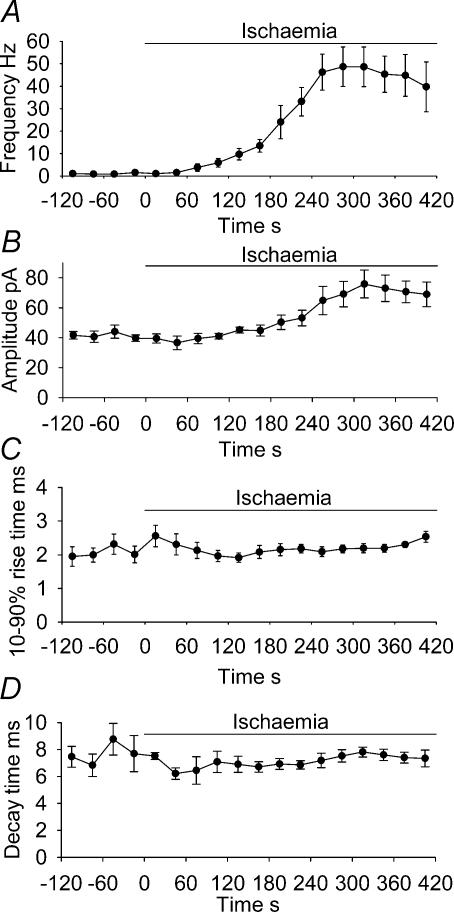
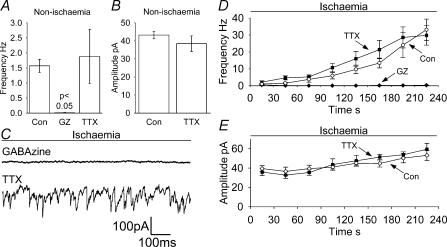
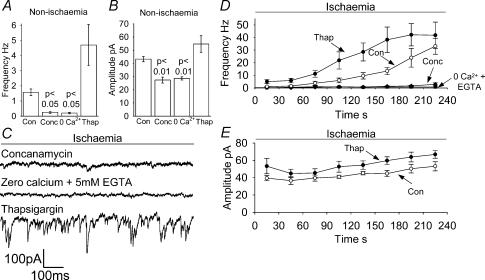
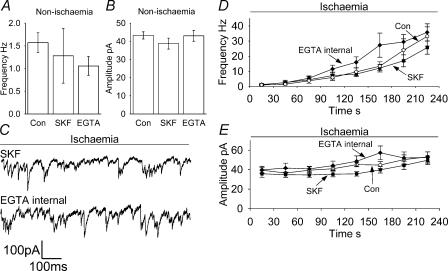
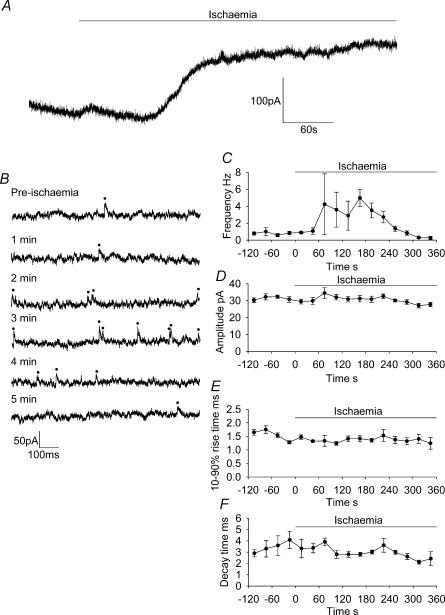
An early consequence of brain energy deprivation is an increase in the frequency of spontaneous inhibitory and excitatory postsynaptic currents (sIPSCs and sEPSCs), which may disrupt neural information processing. This increase in spontaneous transmitter release has been reported to occur in calcium-free solution and has been attributed either to calcium release from internal stores or to a direct effect of hypoxia on the transmitter release mechanism. Here we investigate the mechanism of the increase in sIPSC frequency that occurs in area CA1 of rat hippocampus during simulated ischaemia, by making patch-clamp recordings from CA1 pyramidal neurones. When recording in whole-cell mode, exposure to ischaemic solution increased the sIPSC frequency 30-fold (to 49 Hz) after 5 min, and doubled the sIPSC amplitude. Ischaemic sIPSCs were action potential independent, vesicular in origin and, contrary to the results of earlier studies which did not buffer extracellular calcium to a low level, dependent on extracellular calcium. The properties of the ischaemic sIPSCs were not affected by depleting intracellular stores of calcium or by blocking the neuronal GABA transporter GAT-1. Recording from neurones using gramicidin-perforated patch-clamping showed a 10-fold smaller, more transient increase in sIPSC frequency during ischaemia, with no change of sIPSC amplitude, suggesting that whole-cell clamp recording increases the ischaemia-induced sIPSC rate and amplitude by controlling the intracellular milieu.


Figures

Figure 1
Figure 1. Spontaneous postsynaptic currents in non-ischaemic conditions in a whole-cell clamped CA1 pyramidal neurone
A, 10 s recording from a CA1 cell at −33 mV showing sPSCs (marked with dots). B, 10 s recording from the same CA1 cell in the presence of 10 μm GABAzine to block GABAA receptors, which abolished almost all spontaneous events. C, time versus amplitude distribution plot (each point is a single sPSC) showing the abolition of sPSCs in the presence of GABAzine to block GABAA receptors (sample data from 1 cell, experiment performed on 3 cells, sPSC rate recovers only slowly from GABAzine application).
Figure 2
Figure 2. Properties of sPSCs in ischaemia recorded using whole-cell voltage clamping
A, recording from a CA1 pyramidal neurone at −33 mV showing the increase in spontaneous events (downward current deflections) when ischaemia solution was applied. The anoxic depolarization current is not shown on this record (to allow sPSCs to be seen on a larger scale). B, same record as in A but filtered and on a lower gain and longer time scale, to show the occurrence of the anoxic depolarization current. C, expanded regions of 1 s duration from the trace in A. Pre-ischaemia relates to events before ischaemia, downward deflections are sPSCs. All other traces show events during ischaemia, with the times given representing time elapsed since the ischaemic solution was applied. The bottom trace is an expanded section from the 6 min ischaemia time point, with sPSCs marked with dots. D, cumulative events (per minute) of sPSC amplitudes, in control solution (grey line) and after 5 min ischaemia (black line), averaged over 5 cells. E, the curves in D normalized to the same peak for control (grey line) and ischaemia (black line) conditions. Dashed line is the control curve expanded along the amplitude axis to superimpose on the ischaemia curve.
Figure 3
Figure 3. Summary of sPSC properties (at −33 mV) in ischaemia solution up to the time of the anoxic depolarization
Plots show frequency (A), amplitude (B), 10–90% rise time (C) and decay time of sPSCs during ischaemia (D); points represent 30 s bins of events, averaged over 5 cells.
Figure 4
Figure 4. Effects on sPSCs of GABAzine (GZ, 10 μm) and TTX (1 μm)
A and B, effect of GABAzine (3 cells) and TTX (5 cells) on the sPSC frequency (A) and amplitude (B) in non-ischaemic solution (no amplitude data are plotted for GABAzine because of the very low number of events). P value is compared with control conditions. C–E, data in ischaemia solution. C, sample traces at −33 mV showing sPSCs, taken 4 min after the start of the ischaemic episode in GABAzine- or TTX-containing solution. Average data from 5 cells for frequency (D) and amplitude (E) of sPSCs during ischaemia; points represent 30 s bins of events. Control data from Fig. 3 (Con) are superimposed for comparison. Amplitude data are not shown for GABAzine due to the small number of events measured.
Figure 5
Figure 5. Effects on sIPSCs of pretreatment with concanamaycin, Ca2+-free solution containing 5 mm EGTA, or pretreatment with thapsigargin
A and B, effect of concanamycin pretreatment (Conc, 0.5 μm for at least 2 h, 5 cells), Ca2+-free solution containing 5 mm EGTA (5 cells) and thapsigargin pretreatment (Thap, 3 μm for 1 h, 5 cells) on the sIPSC frequency (A) and amplitude (B) in non-ischaemic solution. P values are compared with control conditions. C–E, data in ischaemia solution. C, sample traces at −33 mV showing sIPSCs, taken 4 min after the start of the ischaemic episode after concanamycin pretreatment, in Ca2+-free/5 mm EGTA solution, and after thapsigargin pretreatment. Average data from 5 cells for frequency (D) and amplitude (E) of sIPSCs during ischaemia; points represent 30 s bins of events. Control data (Con) from Fig. 3 are superimposed for comparison. Amplitude data are not shown for Ca2+-free conditions or concanamycin because of the small number of events measured.
Figure 6
Figure 6. Effects on sIPSCs of the GAT-1 blocker SKF 89976A and of using EGTA rather than BAPTA in the whole-cell pipette to buffer internal calcium concentration
A and B, effect of SKF 89976A (SKF, 5 cells) and EGTA internal (EGTA, 5 cells) on the sIPSC frequency (A) and amplitude (B) in non-ischaemic solution. C–E, data in ischaemia solution. C, sample traces at −33 mV showing sIPSCs, taken 4 min after the start of the ischaemic episode, in SKF 89976A-containing solution, or in normal ischaemic solution when recording with the EGTA internal solution. Average data from 5 cells for frequency (D) and amplitude (E) of sIPSCs during ischaemia; points represent 30 s bins of events. Control data from Fig. 3 are superimposed for comparison (Con).
Figure 7
Figure 7. Properties of sIPSCs in ischaemia recorded using gramicidin perforated patch-clamping
A, recording from a CA1 pyramidal neurone at −33 mV showing the increase in spontaneous IPSCs, and the development of an outward current, when ischaemia solution was applied; an AD occurred a few seconds after the end of the trace, but is not shown in order to display the pre-AD current on a larger scale. B, expanded regions of 1 s duration from the trace in A. Pre-ischaemia represents events before ischaemia, upward deflections are sIPSCs (marked with dots). All other traces show events during ischaemia, with the times stated representing time elapsed since the ischaemic solution was applied. C–F, plots of frequency (C), amplitude (D), 10–90% rise time (E) and decay time of sIPSCs during ischaemia (F); points represent 30 s bins of events, averaged over 5 cells.

References

    1. Akaike N. Gramicidin perforated patch recording and intracellular chloride activity in excitable cells. Prog Biophys Mol Biol. 1996;65:251–264. - PubMed
    1. Allen NJ, Rossi DJ, Attwell D. Sequential release of GABA by exocytosis and reversed uptake leads to neuronal swelling in simulated ischemia of hippocampal slices. J Neurosci. 2004;24:3837–3849. - PMC - PubMed
    1. Behrends JC, Maruyama T, Tokutomi N, Akaike N. Ca2+-mediated suppression of the GABA-response through modulation of chloride channel gating in frog sensory neurones. Neurosci Lett. 1988;86:311–316. - PubMed
    1. Borden LA, Murali Dhar TG, Smith KE, Weinshank RL, Branchek TA, Gluchowski C. Tiagabine, SK&F 89976-A, CI-966 and NNC-711 are selective for the cloned GABA transporter GAT-1. Eur J Pharmacol. 1994;269:219–224. - PubMed
    1. Centonze D, Saulle E, Pisani A, Bernardi G, Calabresi P. Adenosine-mediated inhibition of striatal GABAergic synaptic transmission during in vitro ischaemia. Brain. 2001;124:1855–1865. - PubMed

Publication types

Substances

LinkOut - more resources