. 2004 Nov;13(11):2949-59.
doi: 10.1110/ps.04827604. Epub 2004 Sep 30.

Effect of sodium dodecyl sulfate on folding and thermal stability of acid-denatured cytochrome c: a spectroscopic approach

Affiliations

Effect of sodium dodecyl sulfate on folding and thermal stability of acid-denatured cytochrome c: a spectroscopic approach

Qi Xu et al. Protein Sci. 2004 Nov.

Abstract

The molten globule (MG) state can be an intermediate in the protein folding pathway; thus, its detailed description can help understanding protein folding. Sodium dodecyl sulfate (SDS), an anionic surfactant that is commonly used to mimic hydrophobic binding environments such as cell membranes, is known to denature some native state proteins, including horse cytochrome c (cyt c). In this article, refolding of acid denatured cyt c is studied under the influence of SDS to form MG-like states at both low concentration and above the critical micelle concentration using Fourier transform Infrared (FTIR) and ultraviolet and visible absorption as well as fluorescence and circular dichroism (CD). Thermal denaturation monitored with FTIR and CD shows distinct final high temperature states starting from MG-like states formed with different SDS/protein ratios. The results suggest that the SDS/protein ratio as well as the actual SDS (or protein) concentration affects structure and its thermal stability. Thermal denaturation monitored with CD and FTIR for cyt c at neutral pH but denatured with SDS showed that at a high SDS/protein ratio, the thermal behavior of MG-like states formed at low and neutral pH are quite similar. Based on the results obtained, the merits of two models of the protein-surfactant structure are discussed for different SDS concentrations.


Figures
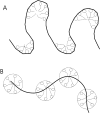
Figure 1.
Figure 1.
The “necklace and bead” structure of protein–surfactant complexes and its two possibilities. (A) The protein wraps around the micelle. (B) The micelles nucleate on the protein hydrophobic sites.
Figure 2.
Figure 2.
SDS titration of 16 μM acid-denatured cyt c (pH = 2). (A) [SDS] at 0, 0.05, 0.1, 0.15, 0.2, and 0.25 mM; inset shows the ellipticity change at 222 nm. (B) [SDS] from 3–60 mM.
Figure 3.
Figure 3.
(A) Time-dependent CD change for 16 μM cyt c with 0.36 mM SDS at low pH under 25°C; inset shows the ellipticity change at 222 nm for which a single exponential curve can fit all the points. (B) FTIR-ATR spectra of cyt–SDS precipitate (dashed line), which resulted from mixing 16 μM cyt c with ~1 mM SDS, and the FTIR transmission spectra for SDS-induced MG-like state (solid line) and acid-denatured state cyt c (dash-dot-dash line). All IR intensities are in arbitrary units.
Figure 4.
Figure 4.
Titration of acid-denatured cyt c with cationic surfactant dodeltrimethylammonium chloride (DTA) from 0.05 mM to 50 mM. The acid denatured cyt c (no surfactant; triangle) is shown as a comparison. Inset shows the ellipticity change at 222 nm.
Figure 5.
Figure 5.
UV-Vis spectra of titration of 16 μM acid-denatured cyt c with SDS at low pH. (A) [SDS] from 0 to 0.2 mM. (B) [SDS] from 3 to 60 mM. Arrows indicate the direction of the change.
Figure 6.
Figure 6.
Fluorescence spectra of titration of 16 μM acid-denatured cyt c with SDS at low pH. (A) [SDS] from 0 to 0.2 mM. (B) [SDS] from 3 to 60 mM. The fluorescence spectrum of cyt c at native state (circles) is shown as a comparison. Arrows indicate the direction of change.
Figure 7.
Figure 7.
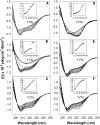
Thermal denaturation of cyt-SDS complexes monitored by far-UV CD. Shown is 16 μM cyt c with a [SDS]/[cyt] ratio of 12 (A), 240 (B), and 1500 (C) at low pH and 12 (D), 235 (E), 1400 (F) at neutral pH.
Figure 8.
Figure 8.
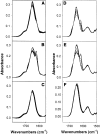
Thermal denaturation of cyt–SDS complexes monitored with FTIR. Shown is 1.6 mM cyt c with a [SDS]/[cyt] ratio at 2 (A), 12 (B), 270 (C) at low pH and 2 (D), 13 (E), 298 (F) at neutral pH.
Figure 9.
Figure 9.
(A) The ratio of amide I intensity at 1620 over 1649 cm−1 for cyt c (~1.6 mM) with SDS at pH ~1.7 with [SDS]/[cyt] = 2 (♦), 12 (•), 270(▴). (B) Singular-value decomposition (SVD) results for the spectra shown in A with [SDS]/[cyt] = 2 (♦), 12 (•), and 12 (~80 μM cyt, ○). (C) The ratio of amide I intensity at 1616 over 1647 cm−1 at pH ~7 with [SDS]/[cyt] = 2 (♦), 13 (•), 298(▴).

References

    1. Bai, Y., Sosnick, T.R., Mayne, L., and Englander, S.W. 1995. Protein folding intermediates: Native-state hydrogen exchange. Science 269 192–197. - PMC - PubMed
    1. Brems, D.N., and Stellwagen, E. 1983. Manipulate of the observed kinetics phases in the refolding of denatured ferricytochromes c. J. Biol. Chem. 258 3655–3660. - PubMed
    1. Bushnell, G.W., Louie, G.V., and Brayer, G.D. 1990. High-resolution three-dimensional structure of horse heart cytochrome c. J. Mol. Biol. 214 585–595. - PubMed
    1. Chattopadhyay, K. and Mazumdar, S. 2003. Stabilization of partially folded states of cytochrome c in aqueous surfactant: Effects of ionic and hydrophobic interactions. Biochemistry 42 14606–14613. - PubMed
    1. Chen, S.H. and Teixeira, J. 1986. Structure and fractal dimension of protein–detergent complexes. Phys. Rev. Lett. 57 2583–2586. - PubMed

Publication types

LinkOut - more resources