Urea modulation of beta-amyloid fibril growth: experimental studies and kinetic models
- PMID: 15459334
- PMCID: PMC2286573
- DOI: 10.1110/ps.04847404
Urea modulation of beta-amyloid fibril growth: experimental studies and kinetic models
Abstract
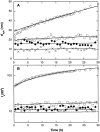
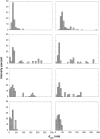
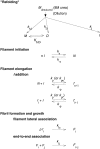
Aggregation of beta-amyloid (Abeta) into fibrillar deposits is widely believed to initiate a cascade of adverse biological responses associated with Alzheimer's disease. Although it was once assumed that the mature fibril was the toxic form of Abeta, recent evidence supports the hypothesis that Abeta oligomers, intermediates in the fibrillogenic pathway, are the dominant toxic species. In this work we used urea to reduce the driving force for Abeta aggregation, in an effort to isolate stable intermediate species. The effect of urea on secondary structure, size distribution, aggregation kinetics, and aggregate morphology was examined. With increasing urea concentration, beta-sheet content and the fraction of aggregated peptide decreased, the average size of aggregates was reduced, and the morphology of aggregates changed from linear to a globular/linear mixture and then to globular. The data were analyzed using a previously published model of Abeta aggregation kinetics. The model and data were consistent with the hypothesis that the globular aggregates were intermediates in the amyloidogenesis pathway rather than alternatively aggregated species. Increasing the urea concentration from 0.4 M to 2 M decreased the rate of filament initiation the most; between 2 M and 4 M urea the largest change was in partitioning between the nonamyloid and amyloid pathways, and between 4 M and 6 M urea, the most significant change was a reduction in the rate of filament elongation.
Figures


Similar articles
-
How do membranes initiate Alzheimer's Disease? Formation of toxic amyloid fibrils by the amyloid β-protein on ganglioside clusters.Acc Chem Res. 2014 Aug 19;47(8):2397-404. doi: 10.1021/ar500127z. Epub 2014 Jul 16. Acc Chem Res. 2014. PMID: 25029558
-
Mechanism of accelerated assembly of beta-amyloid filaments into fibrils by KLVFFK(6).Biophys J. 2004 May;86(5):3194-203. doi: 10.1016/S0006-3495(04)74367-2. Biophys J. 2004. PMID: 15111432 Free PMC article.
-
A mathematical model of the kinetics of beta-amyloid fibril growth from the denatured state.Biophys J. 2001 Sep;81(3):1805-22. doi: 10.1016/S0006-3495(01)75831-6. Biophys J. 2001. PMID: 11509390 Free PMC article.
-
Protein engineering to stabilize soluble amyloid β-protein aggregates for structural and functional studies.FEBS J. 2011 Oct;278(20):3884-92. doi: 10.1111/j.1742-4658.2011.08295.x. Epub 2011 Sep 6. FEBS J. 2011. PMID: 21824290 Review.
-
In vitro oligomerization and fibrillogenesis of amyloid-beta peptides.Subcell Biochem. 2012;65:53-74. doi: 10.1007/978-94-007-5416-4_3. Subcell Biochem. 2012. PMID: 23224999 Review.
Cited by
-
Peptides Composed of Alternating L- and D-Amino Acids Inhibit Amyloidogenesis in Three Distinct Amyloid Systems Independent of Sequence.J Mol Biol. 2016 Jun 5;428(11):2317-2328. doi: 10.1016/j.jmb.2016.03.013. Epub 2016 Mar 21. J Mol Biol. 2016. PMID: 27012425 Free PMC article.
-
Modeling Neurotransmission: Computational Tools to Investigate Neurological Disorders.Int J Mol Sci. 2021 Apr 27;22(9):4565. doi: 10.3390/ijms22094565. Int J Mol Sci. 2021. PMID: 33925434 Free PMC article. Review.
-
Molecular Mechanisms of Inhibition of Protein Amyloid Fibril Formation: Evidence and Perspectives Based on Kinetic Models.Int J Mol Sci. 2022 Nov 3;23(21):13428. doi: 10.3390/ijms232113428. Int J Mol Sci. 2022. PMID: 36362217 Free PMC article. Review.
-
Self-assembly of human latexin into amyloid-like oligomers.BMC Struct Biol. 2007 Nov 8;7:75. doi: 10.1186/1472-6807-7-75. BMC Struct Biol. 2007. PMID: 17996039 Free PMC article.
-
Functional Bacterial Amyloids: Understanding Fibrillation, Regulating Biofilm Fibril Formation and Organizing Surface Assemblies.Molecules. 2022 Jun 24;27(13):4080. doi: 10.3390/molecules27134080. Molecules. 2022. PMID: 35807329 Free PMC article. Review.
References
-
- Antzutkin, O.N., Leapman, R.D., Balbach, J.J., and Tycko, R. 2002. Supramolecular structural constraints on Alzheimer’s β-amyloid fibrils form electron microscopy and solid-state nuclear magnetic resonance. Biochemistry 41 15436–15450. - PubMed
-
- Baskakov, I.V., Legname, G., Baldwin, M.A., Prusiner, S.B., and Cohen, F.E. 2002. Pathway complexity of prion protein assembly into amyloid. J. Biol. Chem. 277 21140–21148. - PubMed
-
- Booth, D.R., Sunde, M., Bellotti, V., Robinson, C.V., Hutchinson, W.L., Fraser, P.E., Hawkins, P.N., Dobson, C.M, Radford, S.E., Blake, C.C., et al. 1997. Instability, unfolding and aggregation of human lysozyme variants underlying amyloid fibrillogenesis. Nature 385 787–793. - PubMed
Publication types
MeSH terms
Substances
Grants and funding
LinkOut - more resources
Full Text Sources

