. 2004;5(10):R73.
doi: 10.1186/gb-2004-5-10-r73. Epub 2004 Sep 23.

A comprehensive transcript index of the human genome generated using microarrays and computational approaches

Affiliations

A comprehensive transcript index of the human genome generated using microarrays and computational approaches

Eric E Schadt et al. Genome Biol. 2004.

Abstract

Background: Computational and microarray-based experimental approaches were used to generate a comprehensive transcript index for the human genome. Oligonucleotide probes designed from approximately 50,000 known and predicted transcript sequences from the human genome were used to survey transcription from a diverse set of 60 tissues and cell lines using ink-jet microarrays. Further, expression activity over at least six conditions was more generally assessed using genomic tiling arrays consisting of probes tiled through a repeat-masked version of the genomic sequence making up chromosomes 20 and 22.

Results: The combination of microarray data with extensive genome annotations resulted in a set of 28,456 experimentally supported transcripts. This set of high-confidence transcripts represents the first experimentally driven annotation of the human genome. In addition, the results from genomic tiling suggest that a large amount of transcription exists outside of annotated regions of the genome and serves as an example of how this activity could be measured on a genome-wide scale.

Conclusions: These data represent one of the most comprehensive assessments of transcriptional activity in the human genome and provide an atlas of human gene expression over a unique set of gene predictions. Before the annotation of the human genome is considered complete, however, the previously unannotated transcriptional activity throughout the genome must be fully characterized.


Figures

Figure 1
Figure 1
A process to generate a comprehensive transcript index (CTI) for the human genome. The first step is the assembly of a comprehensive set of annotations to generate a predicted transcript index (PTI). Sets of microarrays capable of monitoring the transcription activity over the entire genome can then be designed on the basis of the PTI. The different microarray types that can be used in this process include predicted transcript arrays (PTA), exon junction arrays (EJA) [21] and genome tiling arrays (GTA). After hybridizing a diversity of conditions onto these arrays, the transcription data are processed to identify a comprehensive set of transcripts (the CTI) and associated probes that are capable of querying all forms of transcripts that may exist in the genome. This set of probes comprises a focused set of microarrays that can be used in more standard microarray-based experiments.
Figure 2
Figure 2
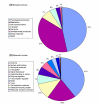
Gene Ontology (GO) classification of novel expression-validated genes (EVGs). EVGs not supported by the expressed sequence data (2,093) were submitted to a search against the Pfam database. Those with significant alignments (339) were assigned GO codes based on Pfam. The pie charts show the distribution of GO terms within this set of EVGs. Note that the total number of GO terms in each category is greater than the number of EVGs because of assignment of multiple GO terms to some EVGs. (a) Distribution of the different 'biological process' GO codes assigned to the EVGs with significant hits to the Pfam database: a total of 526 GO terms. (b) Distribution of the different 'molecular function' GO codes assigned to the EVGs with significant hits to the Pfam database: a total of 374 GO terms.
Figure 3
Figure 3
Utilizing PTA data as an expression index. Absolute transcript abundance over the 60 conditions described in [19] for two expression-supported transcripts. RLP09885002 represents a known gene (ATP1A1, ATPase, Na+/K+ transporting, alpha 1 polypeptide) whereas RLP10406004 was supported solely by gene model predictions before microarray validation.
Figure 4
Figure 4
Examples of tiling results for known genes. The colored bars across the bottom of the data window are color matched with the corresponding exon annotations shown in the genome viewer. (a) The KDELR3 gene shows strong agreement between the public transcript annotations and the tiling results. The top panel represents a screen shot from the UCSC genome browser [60] highlighting KDLER3. The bottom panel represents transcription activity as raw intensities (y-axis) for each probe used to tile through KDLER3 (x-axis), in one of the eight conditions monitored by the genomic tiling arrays. (b) The EWRS1 gene potentially contains a larger number of false-positive predictions, but more probably lends additional experimental support to previously predicted alternative splice forms (EWSR.b and EWSR.g), giving a more accurate representation of the putative structure of this gene. The top panel represents a screen shot from the UCSC genome browser [60] highlighting EWRS1. The bottom panel represents transcription activity as raw intensities (y-axis) for each probe used to tile through EWSR1 (x-axis), in one of the eight conditions monitored by the genomic tiling arrays. (c) Conserved regions between mouse and human upstream of the beta-actin gene. The tiling data readily detect all of the transcribed parts of the gene, but not the conserved regulatory regions. The green bars in the probe-intensity plot represent the annotated transcribed regions for the beta-actin gene, while the blue bars indicate regions that are not known to be transcribed. The lower section shows the sequence conservation between human and mouse as obtained through the program rVISTA [36,61]. Conserved coding (blue peaks) and non-coding regions (red peaks) are shown where the two genomic sequences align with 75% identity over 100-bp windows. The rows marked ELK, ETF, and SRF show binding sites for these transcription factors predicted using TRANSFAC matrix models and the MATCHTM program, which are part of the rVISTA suite. The exons for the gene are shown in blue.

Similar articles

Cited by

References

    1. Liang F, Holt I, Pertea G, Karamycheva S, Salzberg SL, Quackenbush J. Gene index analysis of the human genome estimates approximately 120,000 genes. Nat Genet. 2000;25:239–240. doi: 10.1038/76126. - DOI - PubMed
    1. Lander ES, Linton LM, Birren B, Nusbaum C, Zody MC, Baldwin J, Devon K, Dewar K, Doyle M, FitzHugh W, et al. Initial sequencing and analysis of the human genome. Nature. 2001;409:860–921. doi: 10.1038/35057062. - DOI - PubMed
    1. Venter JC, Adams MD, Myers EW, Li PW, Mural RJ, Sutton GG, Smith HO, Yandell M, Evans CA, Holt RA, et al. The sequence of the human genome. Science. 2001;291:1304–51. doi: 10.1126/science.1058040. - DOI - PubMed
    1. Ewing B, Green P. Analysis of expressed sequence tags indicates 35,000 human genes. Nat Genet. 2000;25:232–234. doi: 10.1038/76115. - DOI - PubMed
    1. Adams MD, Kerlavage AR, Fleischmann RD, Fuldner RA, Bult CJ, Lee NH, EF Kitrkness, Weinstock KG, Gocayne JD, White O, et al. Initial assessment of human gene diversity and expression patterns based upon 83 million nucleotides of cDNA sequence. Nature. 1995;377:3–174. - PubMed

MeSH terms