. 2004 Dec;87(6):3750-63.
doi: 10.1529/biophysj.104.048090. Epub 2004 Oct 1.

Metabolic control analysis under uncertainty: framework development and case studies

Affiliations

Metabolic control analysis under uncertainty: framework development and case studies

Liqing Wang et al. Biophys J. 2004 Dec.

Abstract

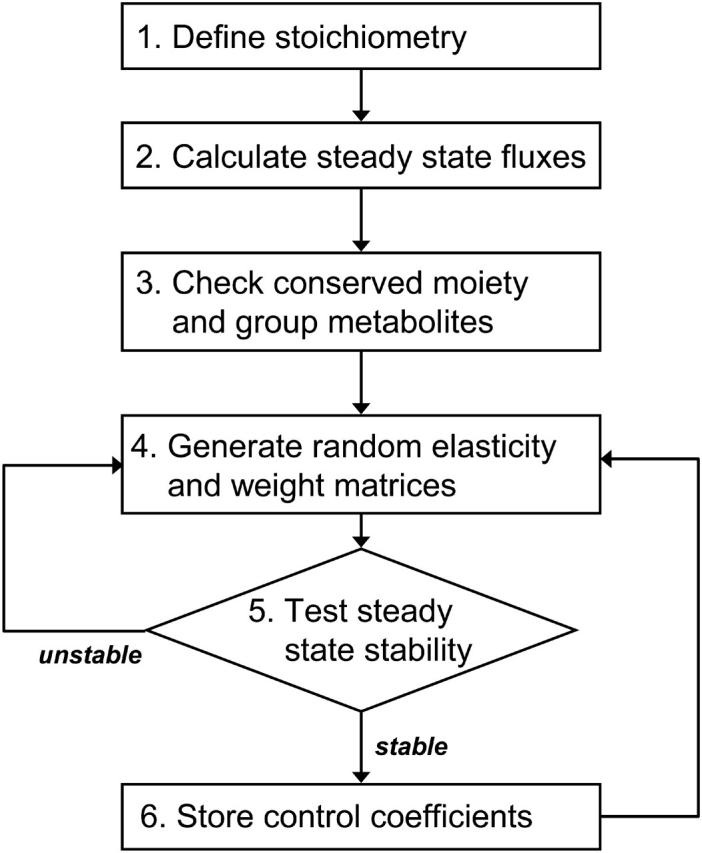
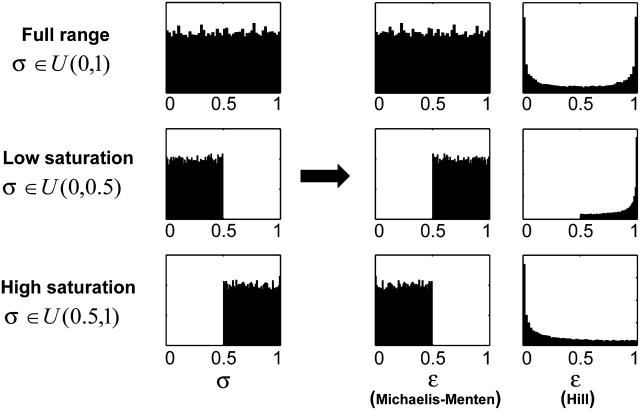
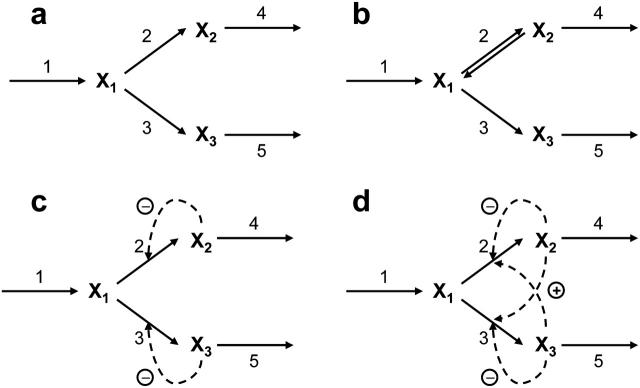
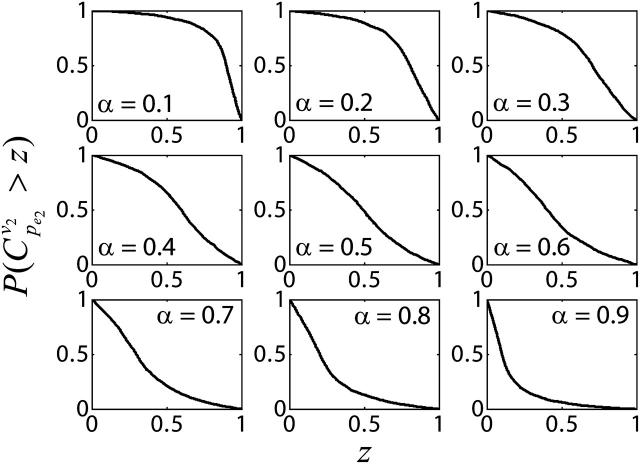
Information about the enzyme kinetics in a metabolic network will enable understanding of the function of the network and quantitative prediction of the network responses to genetic and environmental perturbations. Despite recent advances in experimental techniques, such information is limited and existing experimental data show extensive variation and they are based on in vitro experiments. In this article, we present a computational framework based on the well-established (log)linear formalism of metabolic control analysis. The framework employs a Monte Carlo sampling procedure to simulate the uncertainty in the kinetic data and applies statistical tools for the identification of the rate-limiting steps in metabolic networks. We applied the proposed framework to a branched biosynthetic pathway and the yeast glycolysis pathway. Analysis of the results allowed us to interpret and predict the responses of metabolic networks to genetic and environmental changes, and to gain insights on how uncertainty in the kinetic mechanisms and kinetic parameters propagate into the uncertainty in predicting network responses. Some of the practical applications of the proposed approach include the identification of drug targets for metabolic diseases and the guidance for design strategies in metabolic engineering for the purposeful manipulation of the metabolism of industrial organisms.


Figures

FIGURE 1
FIGURE 1
Diagrammatic description of the Monte Carlo simulation algorithm.
FIGURE 2
FIGURE 2
Uniform sampling of enzyme saturation degrees and randomization of elasticities with respect to metabolites. Histograms of elasticities with respect to metabolites for Michaelis-Menten kinetics and Hill kinetics (Hill coefficient = 2) for uniformly sampled enzyme saturation degree, σ, at three scenarios: uniform sampling between 0 and 1 (upper panels) corresponding to the full range of enzyme saturation degrees; uniform sampling between 0 and 0.5 (middle panel) corresponding to low enzyme saturation; and uniform sampling between 0.5 and 1 (lower panel) corresponding to high enzyme saturation.
FIGURE 3
FIGURE 3
Branched pathway models. Four types of branched biosynthetic pathways consisting of three metabolites: (a) simple irreversible branched pathway; (b) branched pathway with a reversible reaction (ν2); (c) branched pathway with feedback inhibition; and (d) branched pathway with feedback inhibition and crossover activation.
FIGURE 4
FIGURE 4
Effects of splitting ratio on the flux control coefficients in branched pathway. CCDFs of the flux control coefficients formula image of the branched pathway for different splitting ratios, α = v2/v1. The CCDF measures the probability that the random variable formula image is ≥x.
FIGURE 5
FIGURE 5
Effects of equilibrium coefficient ρ on control coefficients. (a) CCDFs of the control coefficient formula image at four different values of the equilibrium coefficient ρ of reaction v2 in the branched pathway with v2/v1 = 0.1. The values are ρ = ∞ (solid line); ρ = 1.1 (dashed line); ρ = 2 (dotted line); and ρ = 10 (dash-dotted line). (b) Box plot of formula image distributions, with middle lines representing the median of the distributions; the lower and the upper bounds of the boxes corresponding to the first and the third quartiles; and the dashed lines extending from each end of the box to show the range of the data.
FIGURE 6
FIGURE 6
Impacts of enzyme regulation on the control coefficients distributions. (a) CCDFs of control coefficient formula image for cases of regulatory structures in the branched pathway with v2/v1 = 0.1. No enzyme regulation (solid line); product competitive inhibition (dashed line); and product competitive inhibition and crossover cooperative activation (dotted line). (b) CCDFs of the control coefficient formula image for the same regulatory structure (product competitive inhibition and crossover cooperative activation) and for different kinetic mechanisms: (1) cooperative activation (solid line); (2) allosteric activation (dashed line); and (3) generic activation (dotted line).
FIGURE 7
FIGURE 7
Anaerobic glycolytic pathway model of nongrowing yeast, S. cerevisiae, with glucose as the sole carbon source. Chemical species: Gin, intracellular glucose; G6P, glucose-6-phosphate; F6P, fructose-6-phosphate; FdP, fructose 1,6-diphosphate; GAP, glyceraldehydes-3-phosphate; DHAP, dihydroxy acetone phosphate; BPG, bisphosphoglycerate; 3PG, 3-phosphoglycerate; 2PG, 2-phosphoglycerate; PEP, phosphoenolpyruvate; PYR, pyruvate; AcAld, acetaldehyde; ETOH, ethanol; ATP, adenosine triphosphate; ADP, adenosine diphosphate; AMP, adenosine monophosphate; NAD and NADH, nicotinamide adenine dinucleotide. Pathway steps and enzymes (in bold): trans, glucose cross-membrane transport; HK, hexokinase; PGI, phosphoglucose isomerase; PFK, phosphofructokinase; ALD, fructose 1,6-diphosphate aldolase; TPI, triose phosphate isomerase; GAPDH, glyceraldehydes-3-phosphate dehydrogenase; PGK, phosphoglycerate kinase; PGM, phosphoglycerate mutase; ENO, enolase; PYK, pyruvate kinase; PDC, pyruvate decarboxylase; ADH, alcohol dehydrogenase; ATPase, net ATP consumption; and AK, adenylate kinase.
FIGURE 8
FIGURE 8
CCDFs of the control coefficients of flux through ADH with respect to glucose transport, PFK, and PYK activity. (a) Control of ethanol production by three enzymes, transporter (dotted line), PFK (dashed line), and PYK (solid line), based on the kinetic mechanisms provided by Teusink et al. (2000). (b) Control of ethanol production by the conserved pyridine nucleotides moiety (solid line) and adenylates moiety (dashed line) based on the kinetic mechanisms provided by Teusink et al. (2000). (c) Control of ethanol production by three enzymes, transporter (dotted line), PFK (dashed line), and PYK (solid line), for unknown kinetic mechanisms. (d) Control of ethanol production by the conserved pyridine nucleotides moiety (solid line) and adenylates moiety (dashed line) for unknown kinetic mechanisms.

References

    1. Almaas, E., B. Kovacs, T. Vicsek, Z. N. Oltvai, and A. L. Barabasi. 2004. Global organization of metabolic fluxes in the bacterium Escherichia coli. Nature. 427:839–843. - PubMed
    1. Alves, R., and M. A. Savageau. 2000. Systemic properties of ensembles of metabolic networks: application of graphical and statistical methods to simple unbranched pathways. Bioinformatics. 16:534–547. - PubMed
    1. Andersen, K. B., and K. von Meyenburg. 1977. Charges of nicotinamide adenine nucleotides and adenylate energy charge as regulatory parameters of the metabolism in Escherichia coli. J. Biol. Chem. 252:4151–4156. - PubMed
    1. Atkinson, D. E. 1968. The energy charge of the adenylate pool as a regulatory parameter. Interaction with feedback modifiers. Biochemistry. 7:4030–4034. - PubMed
    1. Bailey, J. E. 1991. Toward a science of metabolic engineering. Science. 252:1668–1675. - PubMed

Publication types

MeSH terms

Substances