. 2004 Dec;87(6):4226-36.
doi: 10.1529/biophysj.104.042333. Epub 2004 Oct 1.

Visualization and mechanical manipulations of individual fibrin fibers suggest that fiber cross section has fractal dimension 1.3

Affiliations

Visualization and mechanical manipulations of individual fibrin fibers suggest that fiber cross section has fractal dimension 1.3

M Guthold et al. Biophys J. 2004 Dec.

Abstract

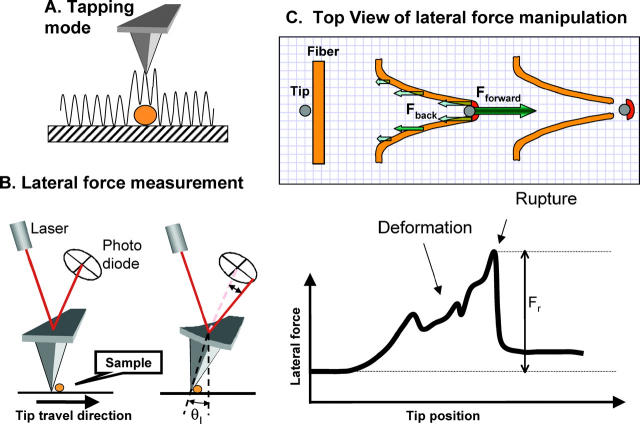
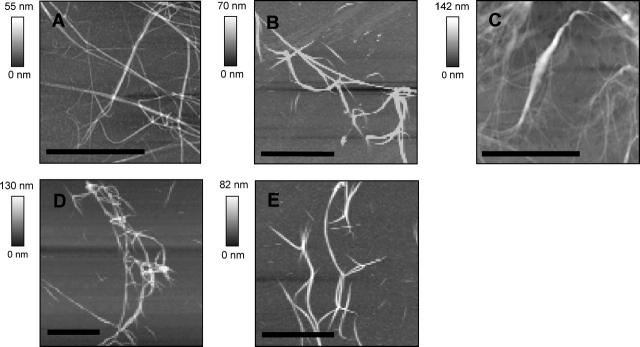
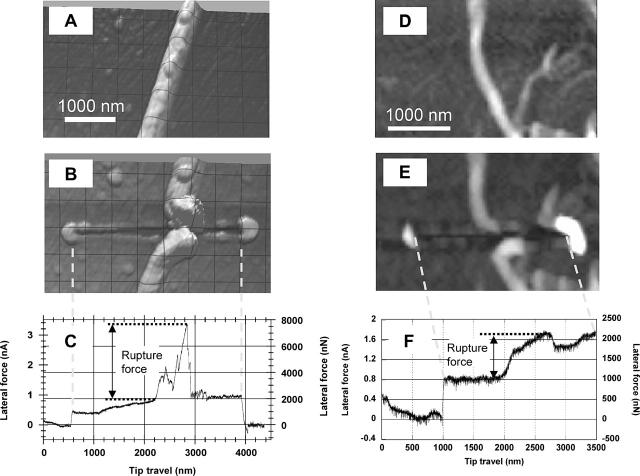
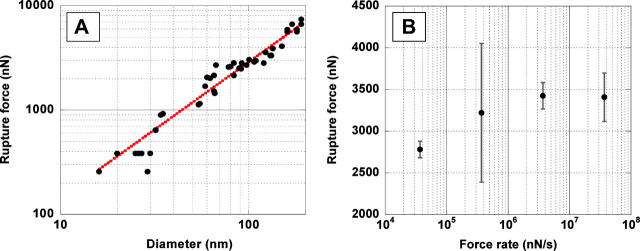
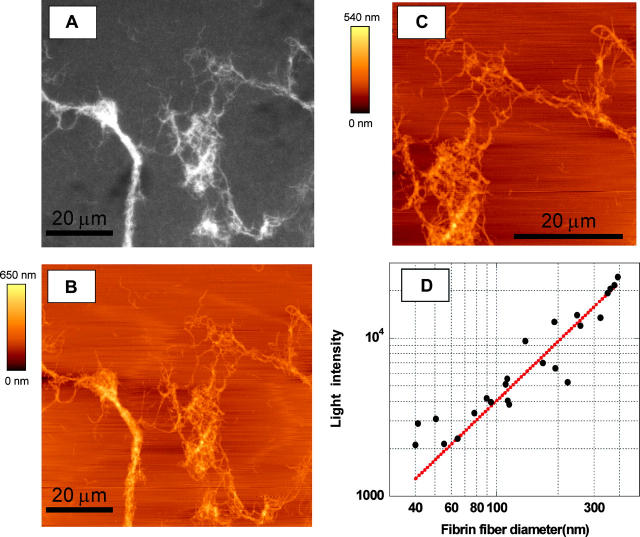
We report protocols and techniques to image and mechanically manipulate individual fibrin fibers, which are key structural components of blood clots. Using atomic force microscopy-based lateral force manipulations we determined the rupture force, FR, f fibrin fibers as a function of their diameter, D, in ambient conditions. As expected, the rupture force increases with increasing diameter; however, somewhat unexpectedly, it increases as FR approximately D1.30+/-0.06. Moreover, using a combined atomic force microscopy-fluorescence microscopy instrument, we determined the light intensity, I, of single fibers, that were formed with fluorescently labeled fibrinogen, as a function of their diameter, D. Similar to the force data, we found that the light intensity, and thus the number of molecules per cross section, increases as I approximately D1.25+/-0.11. Based on these findings we propose that fibrin fibers are fractals for which the number of molecules per cross section increases as about D1.3. This implies that the molecule density varies as rhoD approximately D -0.7, i.e., thinner fibers are denser than thicker fibers. Such a model would be consistent with the observation that fibrin fibers consist of 70-80% water and only 20-30% protein, which also suggests that fibrin fibers are very porous.


Figures

FIGURE 1
FIGURE 1
TEM image (90,000×) of the cross section of a fibrin fiber.
FIGURE 2
FIGURE 2
Lateral force manipulation scheme. (A) Tapping mode AFM imaging. The tip oscillates over and slightly taps the sample, thus exerting minimal lateral force on the sample. (B) For lateral force manipulations the tip is pressed down with a constant normal force and moved laterally. The twist of the cantilever is measured via a quadrant photodiode. (C) Schematics of a fiber manipulation. The tip contacts the fiber, and stretches it until it ruptures. The drawing is approximately to scale for a 100-nm thick fiber being stretched 700 nm before it ruptures. During a manipulation, two main forces (a force pair) act on the fiber segment that ruptures (dark red): i), the backward distributed frictional force; and ii), the forward applied tip force. Those two forces balance each other and cause the fiber to deform and to eventually rupture. The highest peak in the force versus distance curve is attributed to the rupture event.
FIGURE 3
FIGURE 3
AFM images of fibrin fibers on (A) mica, (B) silicon, (C) glass, (D) CH3-functionalized silicon, and (E) NH2-functionalized silicon. Scale bar 10 μm, except in C, where it is 5 μm.
FIGURE 4
FIGURE 4
AFM image of a 180-nm fibrin fiber before (A) and after (B) being ruptured by the AFM tip. (C) Corresponding lateral force versus tip travel during this manipulation. The steps at 600 nm and at 3900 nm in the force trace are due to a reversal in tip travel (i.e., a friction loop); the peak at 2900 nm is the rupture force of the fiber. Dotted vertical line between B and C aligns scratched trace in image (B) with tip travel in (C). (DF) Images and force curve for the rupture of a 53-nm fiber. The step at 1000 nm is due to a friction loop; the tip contacts the fiber at 1900 nm; the fiber ruptures at 2700 nm.
FIGURE 5
FIGURE 5
(A) Log-log plot of the rupture force of fibers versus their diameter; dotted line is best exponential curve fit yielding FD1.30±0.06. (B) Plot of the rupture force versus log of force rate.
FIGURE 6
FIGURE 6
(A) Fluorescence microscopy image of Oregon Green-labeled fibrin clot; (B) AFM image; and (C) zoomed AFM image of the same section of the fibrin clot. (D) Log-log plot of the fluorescence intensity versus fiber diameter; dotted line is best exponential curve fit yielding ID1.25±0.11

References

    1. Bell, G. 1978. Models for the specific adhesion of cells to cells. Science. 200:616–627. - PubMed
    1. Bilas, P., L. Romana, B. Kraus, Y. Bercion, and J. L. Mansot. 2004. Quantitative characterization of friction coefficient using lateral force microscope in the wearless regime. Rev. Sci. Instrum. 75:415–421.
    1. Blinc, A., J. Magdic, J. Fric, and I. Musevic. 2000. Atomic force microscopy of fibrin networks and plasma clots during fibrinolysis. Fibrinolysis and Proteolysis. 14:288–299.
    1. Blomback, B., M. Blomback, and I. M. Nillson. 1958. Coagulation studies on reptilase, an extract of the venom from Bothrups jararaca. Thromb. Diath. Haemorrh. 1:76–86. - PubMed
    1. Brown, J. H., N. Volkmann, G. Jun, A. H. Henschen-Edman, and C. Cohen. 2000. The crystal structure of modified bovine fibrinogen. Proc. Natl. Acad. Sci. USA. 97:85–90. - PMC - PubMed

Publication types