

Decoding human regulatory circuits
- PMID: 15466295
- PMCID: PMC524421
- DOI: 10.1101/gr.2589004
Decoding human regulatory circuits
Abstract
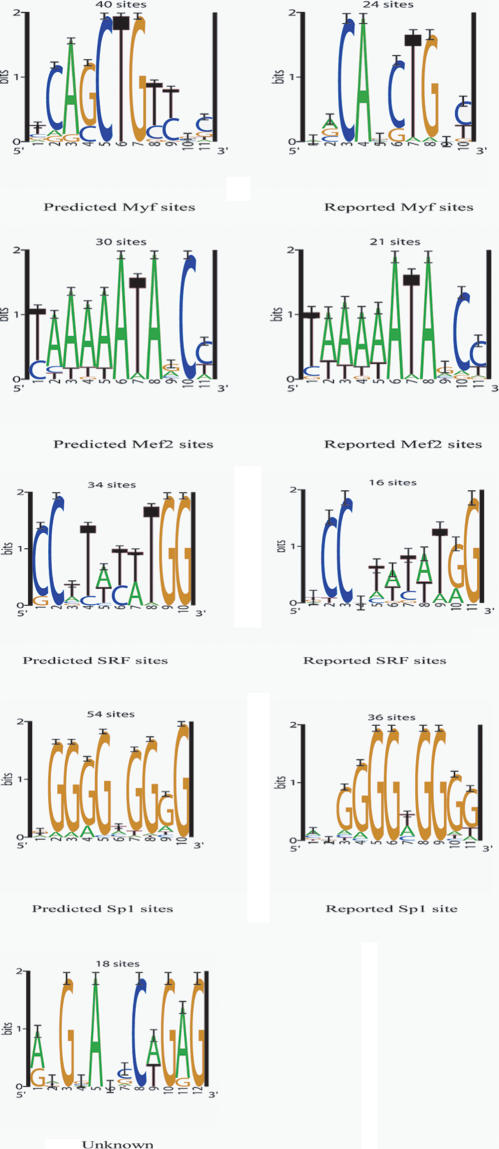
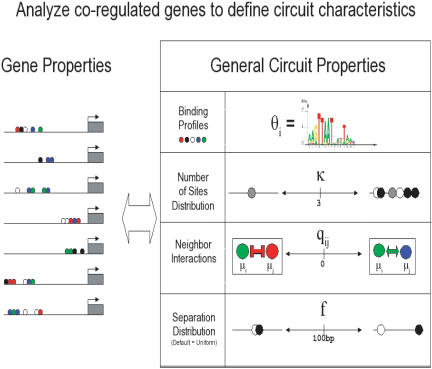
Clusters of transcription factor binding sites (TFBSs) which direct gene expression constitute cis-regulatory modules (CRMs). We present a novel algorithm, based on Gibbs sampling, which locates, de novo, the cis features of these CRMs, their component TFBSs, and the properties of their spatial distribution. The algorithm finds 69% of experimentally reported TFBSs and 85% of the CRMs in a reference data set of regions upstream of genes differentially expressed in skeletal muscle cells. A discriminant procedure based on the output of the model specifically discriminated regulatory sequences in muscle-specific genes in an independent test set. Application of the method to the analysis of 2710 10-kb fragments upstream of annotated human genes identified 17 novel candidate modules with a false discovery rate </=0.05, demonstrating the applicability of the method to genome-scale data.
Figures
References
-
- Aerts, S., Van Loo, P., Thijs, G., Moreau, Y., and De Moor, B. 2003. Computational detection of cis-regulatory modules. Bioinformatics 19: 5ii-14ii. - PubMed
-
- Aicher, W.K., Sakamoto, K.M., Hack, A., and Eibel, H. 1999. Analysis of functional elements in the human Egr-1 gene promoter. Rheumatol. Int. 18: 207-214. - PubMed
-
- Bischoff, C., Kahns, S., Lund, A., Jorgensen, H.F., Praestegaard, M., Clark, B.F.C., and Leffers, H. 2000. The Human Elongation Factor 1 A-2 Gene (EEF1A2): Complete sequence and characterization of gene structure and promoter activity*1. Genomics 68: 63-70. - PubMed
-
- Boffelli, D., McAuliffe, J., Ovcharenko, D., Lewis, K.D., Ovcharenko, I., Pachter, L., and Rubin, E.M. 2003. Phylogenetic shadowing of primate sequences to find functional regions of the human genome. Science 299: 1391-1394. - PubMed
-
- Brenner, V. 1998. Von der Sequenz zur Funktion: Genomanalyse einer 102 KB-Region des humanen X-Chromosoms. Friedrich-Schiller University, Jena, Germany.
WEB SITE REFERENCES
-
- http://jaspar.cgb.ki.se; JASPAR database.
-
- http://bayesweb.wadsworth.org/gibbs/module; Module sampler results and data.
-
- http://www.repeatmasker.org/; RepeatMasker.
-
- http://www.gene-regulation.com; TRANSFAC.
Publication types
MeSH terms
Substances
Grants and funding
LinkOut - more resources
Full Text Sources