. 2004 Oct;70(10):6188-96.
doi: 10.1128/AEM.70.10.6188-6196.2004.

Stratified growth in Pseudomonas aeruginosa biofilms

Affiliations

Stratified growth in Pseudomonas aeruginosa biofilms

Erin Werner et al. Appl Environ Microbiol. 2004 Oct.

Abstract

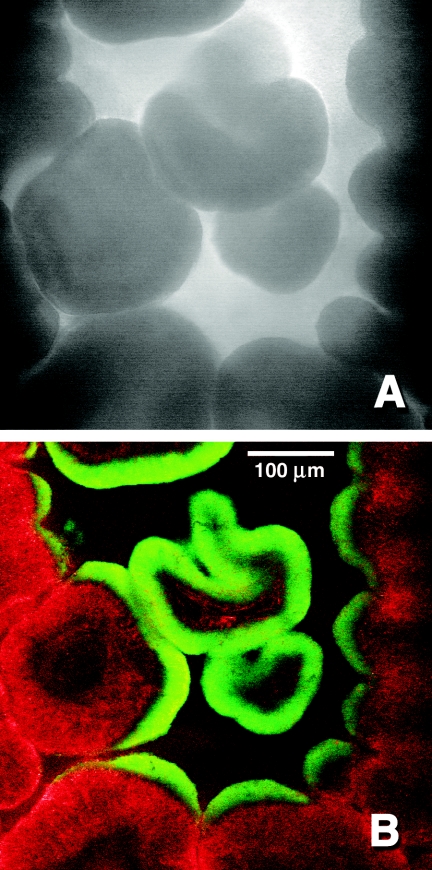
In this study, stratified patterns of protein synthesis and growth were demonstrated in Pseudomonas aeruginosa biofilms. Spatial patterns of protein synthetic activity inside biofilms were characterized by the use of two green fluorescent protein (GFP) reporter gene constructs. One construct carried an isopropyl-beta-d-thiogalactopyranoside (IPTG)-inducible gfpmut2 gene encoding a stable GFP. The second construct carried a GFP derivative, gfp-AGA, encoding an unstable GFP under the control of the growth-rate-dependent rrnBp(1) promoter. Both GFP reporters indicated that active protein synthesis was restricted to a narrow band in the part of the biofilm adjacent to the source of oxygen. The zone of active GFP expression was approximately 60 microm wide in colony biofilms and 30 microm wide in flow cell biofilms. The region of the biofilm in which cells were capable of elongation was mapped by treating colony biofilms with carbenicillin, which blocks cell division, and then measuring individual cell lengths by transmission electron microscopy. Cell elongation was localized at the air interface of the biofilm. The heterogeneous anabolic patterns measured inside these biofilms were likely a result of oxygen limitation in the biofilm. Oxygen microelectrode measurements showed that oxygen only penetrated approximately 50 microm into the biofilm. P. aeruginosa was incapable of anaerobic growth in the medium used for this investigation. These results show that while mature P. aeruginosa biofilms contain active, growing cells, they can also harbor large numbers of cells that are inactive and not growing.


Figures

FIG. 1.
FIG. 1.
Capillary reactor for biofilm growth. The growth medium was pumped continuously through a 1-mm-square glass capillary that was inoculated with P. aeruginosa.
FIG. 2.
FIG. 2.
Induction of GFP in planktonic P. aeruginosa cultures under aerobic (A) or anaerobic (B) conditions. Time zero on the x axis corresponds to the addition of 1 mM IPTG to the culture. •, IPTG added; ○, negative control.
FIG. 3.
FIG. 3.
Optical density (A) and specific GFP fluorescence (B) in planktonic P. aeruginosa cultures induced with IPTG under aerobic (○) and anaerobic (•) conditions. Time zero on the x axis corresponds to the addition of 1 mM IPTG to the culture. Specific GFP fluorescence was calculated as follows: (GFP fluorescence − initial fluorescence)/optical density (OD) at 600 nm.
FIG. 4.
FIG. 4.
Stratified patterns of GFP expression in frozen sections of P. aeruginosa colony biofilms. Green areas are due to GFP and red areas are due to the rhodamine B counterstain. Panel A shows a negative control in which a colony biofilm formed by strain PAO1(pAB1) was not induced. Panel B shows a biofilm of the same strain after 4 h of induction with IPTG. Panel C shows a colony biofilm formed by the reporter strain AH298.
FIG. 5.
FIG. 5.
Oxygen concentration profiles for P. aeruginosa colony biofilms. Triplicate data sets are shown for each strain. Depth zero on the x axis corresponds to the air-colony interface.
FIG. 6.
FIG. 6.
Transmission electron microscopy of P. aeruginosa PAO1 in colony biofilms. Treated specimens were exposed to 150 μg of carbenicillin ml−1 in TSA for 12 h. The control remained on TSA for the same 12-h period.
FIG. 7.
FIG. 7.
Distribution of cell lengths within P. aeruginosa colony biofilms treated with carbenicillin (•) and in an untreated control (○). The distance scale on the x axis is the perpendicular distance of a cell from the membrane divided by the total thickness of the biofilm.
FIG. 8.
FIG. 8.
Stratified pattern of GFP expression in P. aeruginosa biofilms grown in glass capillary tubes under continuous flow conditions. Strain PAO1(pAB1) was grown for 24 h and then induced with IPTG for 4 h. Panel A shows a laser transmission view, and panel B shows a fluorescence image of the same spot. Green areas are due to GFP and red areas are due to the rhodamine B counterstain.

References

    1. Anderl, J. N., M. J. Franklin, and P. S. Stewart. 2000. Role of antibiotic penetration limitation in Klebsiella pneumoniae biofilm resistance to ampicillin and ciprofloxacin. Antimicrob. Agents Chemother. 44:1818-1824. - PMC - PubMed
    1. Borriello, G., E. Werner, F. Roe, A. M. Kim, G. D. Ehrlich, and P. S. Stewart. 2004. Oxygen limitation contributes to antibiotic tolerance of Pseudomonas aeruginosa in biofilms. Antimicrob. Agents Chemother. 48:2659-2664. - PMC - PubMed
    1. Brock, T. D., and K. O'Dea. 1977. Amorphous ferrous sulfide as a reducing agent for culture of anaerobes. Appl. Environ. Microbiol. 33:254-256. - PMC - PubMed
    1. Cormack, B. P., R. H. Valdivia, and S. Falkow. 1996. FACS-optimized mutants of the green fluorescent protein (GFP). Gene 173:33-38. - PubMed
    1. Figurski, D., and D. R. Helinski. 1979. Replication of an origin-containing derivative of plasmid RK2 dependent on a plasmid function provided in trans. Proc. Natl. Acad. Sci. USA 76:1648-1652. - PMC - PubMed

Publication types

MeSH terms