Comparative Study
. 2004 Oct 4;200(7):847-56.
doi: 10.1084/jem.20041236.

Imaging the single cell dynamics of CD4+ T cell activation by dendritic cells in lymph nodes

Affiliations
Comparative Study

Imaging the single cell dynamics of CD4+ T cell activation by dendritic cells in lymph nodes

Mark J Miller et al. J Exp Med. .

Abstract

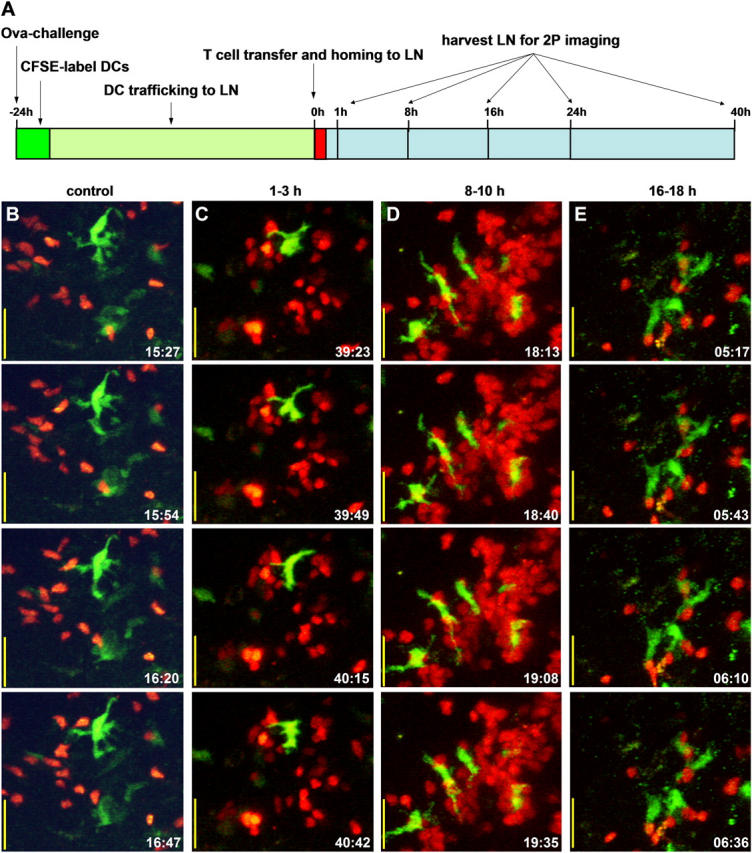
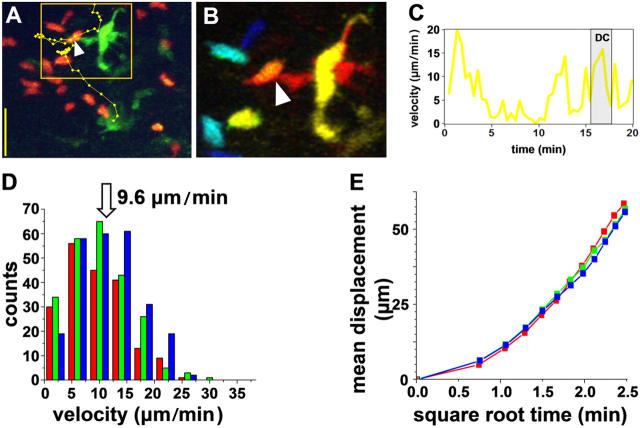
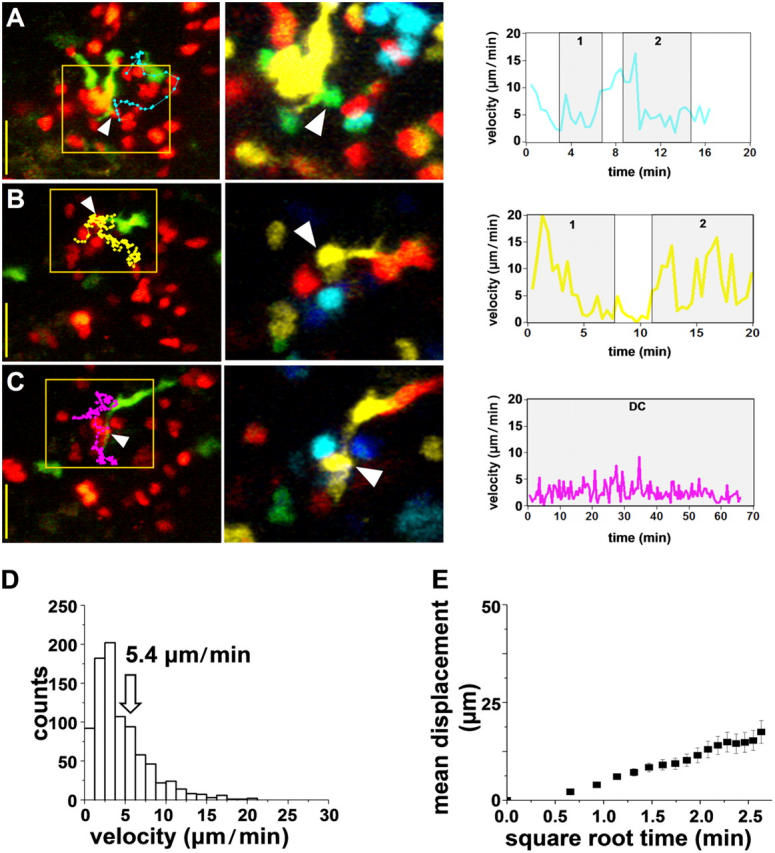
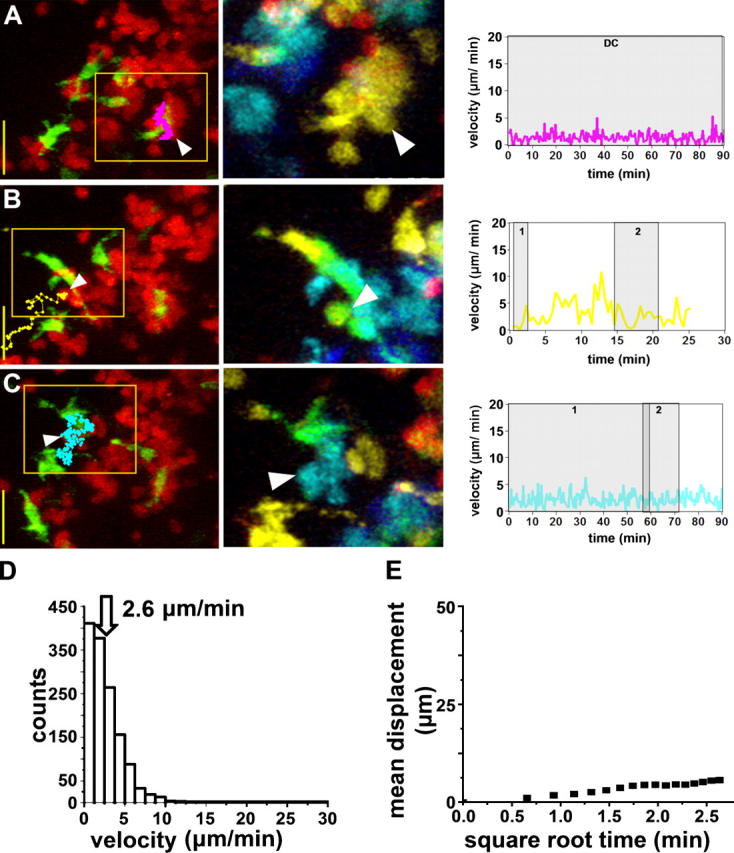
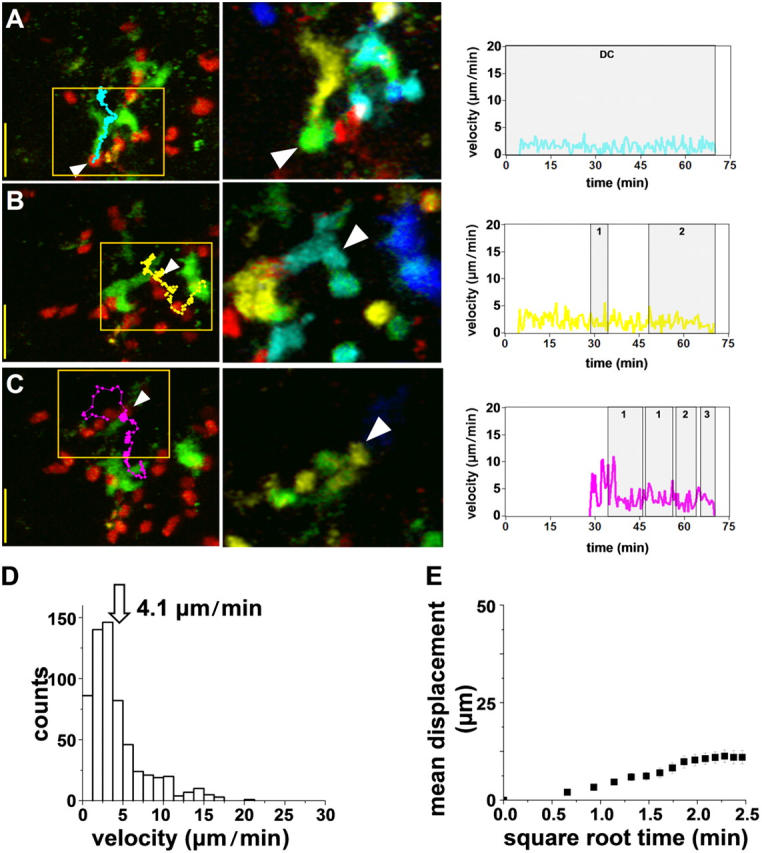
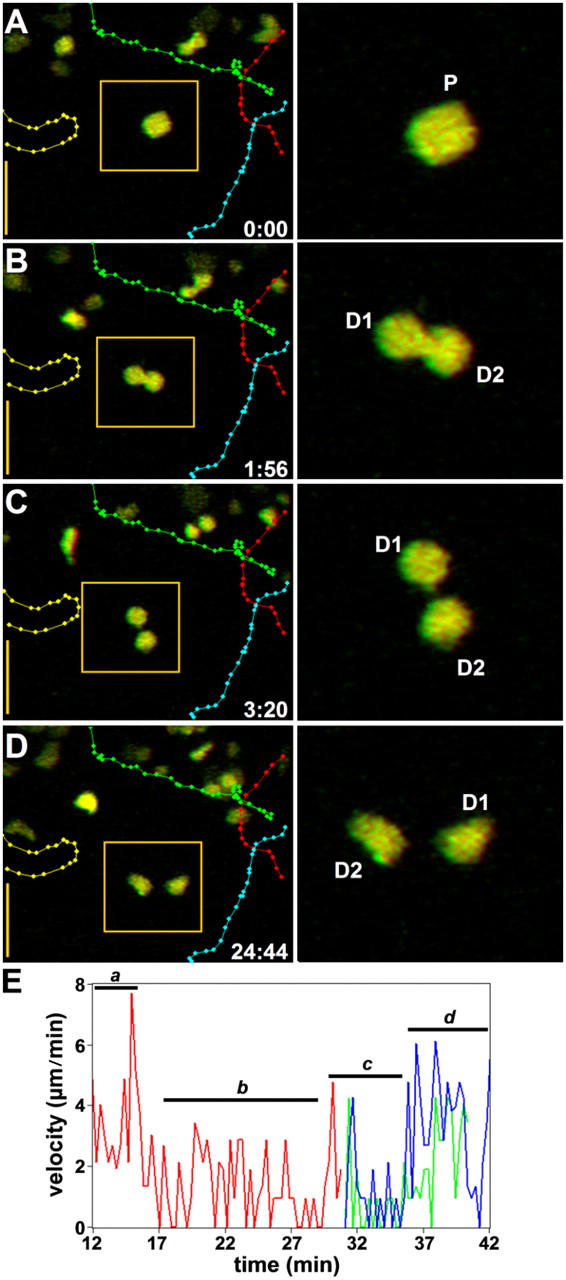
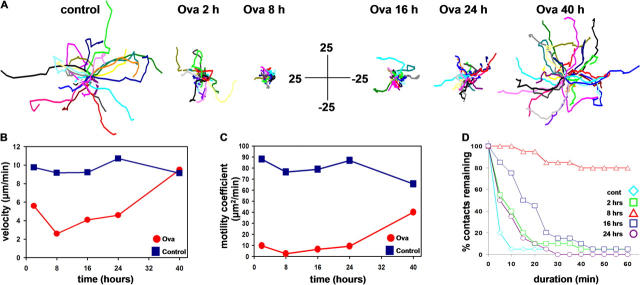
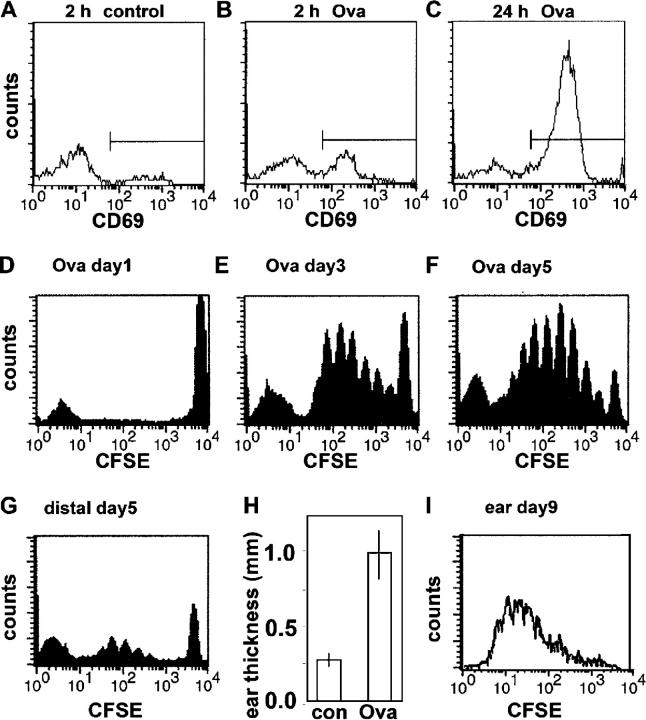
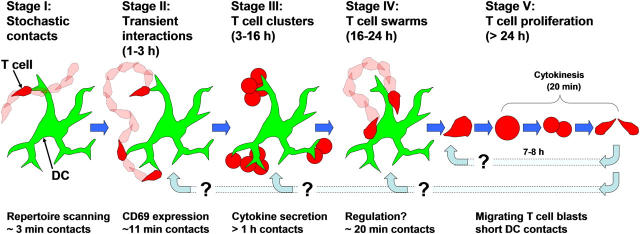
The adaptive immune response is initiated in secondary lymphoid organs by contact between antigen-bearing dendritic cells (DCs) and antigen-specific CD4+ T cells. However, there is scant information regarding the single cell dynamics of this process in vivo. Using two-photon microscopy, we imaged the real-time behavior of naive CD4+ T cells and in vivo-labeled DCs in lymph nodes during a robust T cell response. In the first 2 h after entry into lymph nodes, T cells made short-lived contacts with antigen-bearing DCs, each contact lasting an average of 11-12 min and occurring mainly on dendrites. Altered patterns of T cell motility during this early stage of antigen recognition promoted serial engagement with several adjacent DCs. Subsequently, T cell behavior progressed through additional distinct stages, including long-lived clusters, dynamic swarms, and finally autonomous migration punctuated by cell division. These observations suggest that the immunological synapse in native tissues is remarkably fluid, and that stable synapses form only at specific stages of antigen presentation to T cells. Furthermore, the serial nature of these interactions implies that T cells activate by way of multiple antigen recognition events.


Figures

Figure 1.
Figure 1.
Two-photon imaging of T cell activation in the lymph node. (A) Time line of our experimental protocol. (B–E) Time lapse images of T cells (red) and DCs (green), displayed as maximum intensity projections along the z axis (top view) through image stacks encompassing a volume of 120 × 100 × 75 μm (x, y, z) in the lymph node. Each column shows individual “snapshots,” acquired at the times indicated (in min:s) within a continuous time lapse sequence. The sequence in B illustrates noncognate interactions in the absence of antigen. Image sequences in C–E illustrate the main stages of cognate T cell–DC interactions observed in nodes from OVA-primed mice at respective times of 1, 8, and 16 h after adoptive transfer of DO11.10 T cells. Bars, 25 μm.
Figure 2.
Figure 2.
Noncognate interactions at various times after T cell homing. (A–C) Representative interactions between T cells and DCs 12 h after adoptive transfer in a control mouse without antigen. (A) True-color image of a single time point showing a T cell (red) contacting a DC (green) with a superimposed track showing the position of the T cell at 27-s intervals. Bar, 25 μm. (B) Pseudo-colored image showing an enlarged portion of the image in A, with depth of cells in the imaging volume encoded on a “rainbow” scale (top, red, and bottom, blue). Arrow marks a contact between the T cell and DC. (C) Changes in instantaneous velocity of the T cell tracked in A. Shaded region corresponds to the time the T cell was contacting the DC. (D) Distributions of instantaneous T cell velocities, measured at times of 1–3 h (red bars; n = 15 cells), 8–10 h (green; 16 cells), and 18–20 h (blue; 18 cells) after adoptive transfer. (E) Mean T cell displacement plotted as a function of the square root of time. Points fall on straight lines, consistent with random movement, and the slopes represent the motility coefficient. Data for different periods after adoptive transfer overlap closely.
Figure 3.
Figure 3.
Early cognate interactions, 1–3 h. (A–C) Three examples of T cell–DC interactions imaged 1–3 h after adoptive transfer into an OVA-challenged mouse. Each row shows a true-color snapshot with overlain T cell track. Bars, 25 μm. Zoomed depth-encoded image and plot of T cell velocity with periods of DC contact shaded as in Fig. 2, A–C. Numbers indicate serial contacts with different DCs. (D) Distribution of instantaneous T cell velocities (n = 30 cells). (E) Mean displacement plotted as a function of the square root of time.
Figure 4.
Figure 4.
T cell clusters after T cell transfer. (A–E) Cognate T cell–DC interactions imaged 8–10 h after adoptive transfer into an OVA-challenged mouse. Images and measurements from 39 T cells were obtained as in Fig. 3. Numbers within shaded regions indicate serial contacts with different DCs. In C, a T cell contacts two DCs simultaneously between 58 and 60 min.
Figure 5.
Figure 5.
Late T cell swarms. (A–E) Cognate T cell–DC interactions imaged 16–18 h after adoptive transfer into an OVA-challenged mouse. Images and measurements from 23 cells were obtained as in Figs. 2–4.
Figure 6.
Figure 6.
T cell proliferation and resumption of motility. (A–D) Time lapse sequence showing T cell motility and cell division 26 h after T cell transfer. (left) Full-frame images with superimposed tracks of four T cells (different colors). Bars, 25 μm. (right) Frames show an enlarged view of a T cell blast in the middle of the imaging volume (left, boxed area). Both sets of images are red-green anaglyphs and can be viewed through red-green stereoscopic glasses. This parental cell (P) undergoes cleavage over a period of ∼3 min (the time stamp shows elapsed time min:s) to produce two daughter cells (D1 and D2) that begin to move independently after ∼20 min. (E) Measurements from a different example of T cell division, showing changes in instantaneous velocity of a T cell blast (red trace) as it migrates (a), pauses (b), and divides (c) into daughter cells (blue and green traces) that each resume independent motility (d).
Figure 7.
Figure 7.
Analysis of T cell motility at different stages of activation. (A) Tracks of individual T cells (different colors, normalized to their starting coordinates) showing representative motility of cells in control experiments (without OVA) and at various times as indicated in OVA-challenged mice. Bars are in micrometers. (B) Average instantaneous velocities of T cells in antigen-challenged (red) and control sham-treated mice (blue) as a function of time after adoptive transfer. (C) Corresponding measurements of motility coefficients, derived from plots of mean displacement against square root of time. (D) T cell–DC contact durations in control and OVA-immunized mice at various times (indicated by differently colored symbols) after adoptive transfer. Cumulative plots show the percentage of T cells that remained in contact for any given duration.
Figure 8.
Figure 8.
Kinetics of T cell activation, proliferation, and effector response. (A–C) CD69 expression by DO11.10 T cells in control and OVA-challenged mice at the times indicated. (D–F) T cell proliferation assessed by CFSE dilution measured 1, 3, and 5 d after adoptive transfer. (G) OVA-specific T cells are present in distal lymph nodes on day 5 after OVA challenge. (H) DTH assayed by ear thickness on day 9, 24 h after challenge with soluble OVA. (I) OVA-specific T cells recovered from the DTH site on day 9 after OVA challenge.
Figure 9.
Figure 9.
Proposed stages of antigen recognition and CD4+ T cell activation.

References

    1. Mellman, I., and R.M. Steinman. 2001. Dendritic cells: specialized and regulated antigen processing machines. Cell. 106:255–258. - PubMed
    1. Jenkins, M.K., A. Khoruts, E. Ingulli, D.L. Mueller, S.J. McSorley, R.L. Reinhardt, A. Itano, and K.A. Pape. 2001. In vivo activation of antigen-specific CD4 T cells. Annu. Rev. Immunol. 19:23–45. - PubMed
    1. Cahalan, M.D., I. Parker, S.H. Wei, and M.J. Miller. 2003. Real-time imaging of lymphocytes in vivo. Curr. Opin. Immunol. 15:372–377. - PMC - PubMed
    1. Germain, R.N., and M.K. Jenkins. 2004. In vivo antigen presentation. Curr. Opin. Immunol. 16:120–125. - PubMed
    1. Dustin, M.L., and J.A. Cooper. 2000. The immunological synapse and the actin cytoskeleton: molecular hardware for T cell signaling. Nat. Immunol. 1:23–29. - PubMed

Publication types