Comparative Study
. 2004 Oct 4;200(7):871-82.
doi: 10.1084/jem.20031556.

GATA-2 plays two functionally distinct roles during the ontogeny of hematopoietic stem cells

Affiliations
Comparative Study

GATA-2 plays two functionally distinct roles during the ontogeny of hematopoietic stem cells

Kam-Wing Ling et al. J Exp Med. .

Abstract

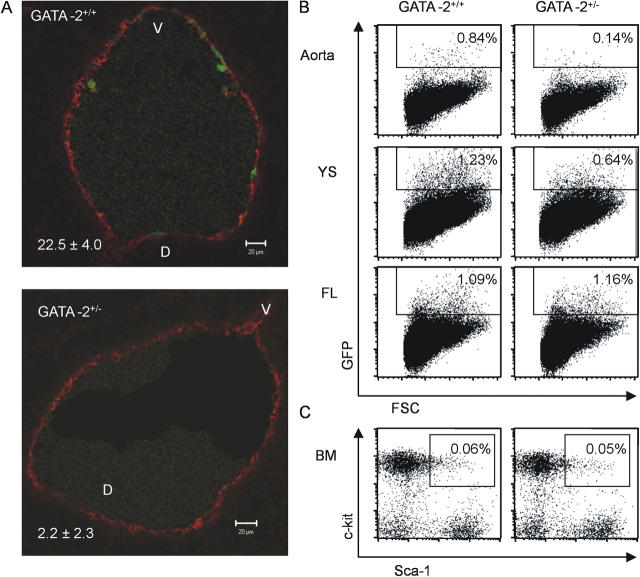
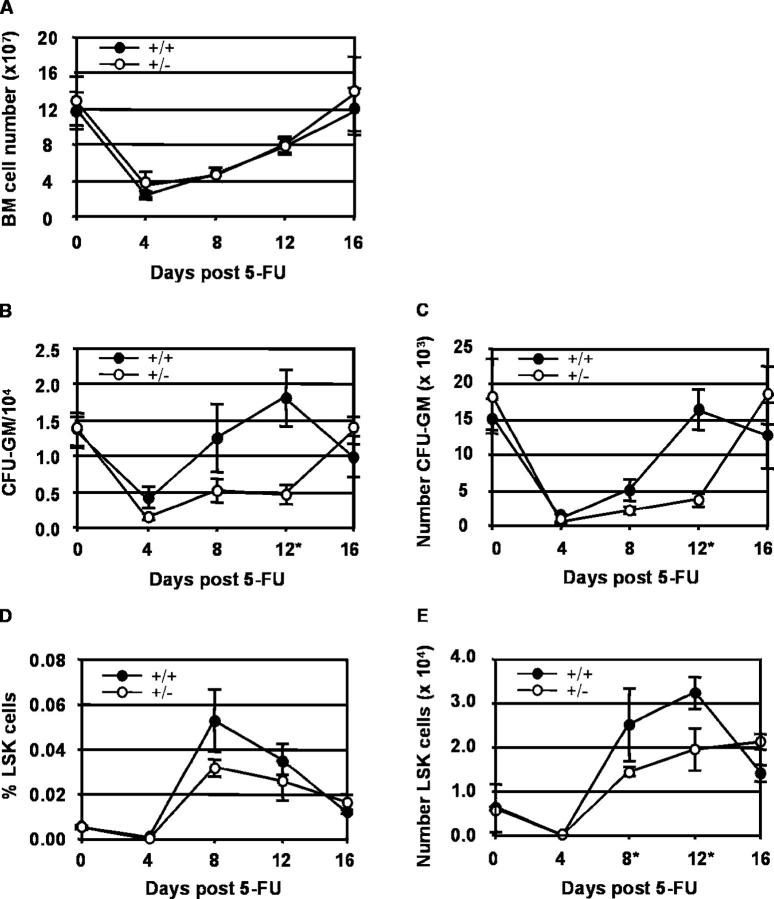
GATA-2 is an essential transcription factor in the hematopoietic system that is expressed in hematopoietic stem cells (HSCs) and progenitors. Complete deficiency of GATA-2 in the mouse leads to severe anemia and embryonic lethality. The role of GATA-2 and dosage effects of this transcription factor in HSC development within the embryo and adult are largely unexplored. Here we examined the effects of GATA-2 gene dosage on the generation and expansion of HSCs in several hematopoietic sites throughout mouse development. We show that a haploid dose of GATA-2 severely reduces production and expansion of HSCs specifically in the aorta-gonad-mesonephros region (which autonomously generates the first HSCs), whereas quantitative reduction of HSCs is minimal or unchanged in yolk sac, fetal liver, and adult bone marrow. However, HSCs in all these ontogenically distinct anatomical sites are qualitatively defective in serial or competitive transplantation assays. Also, cytotoxic drug-induced regeneration studies show a clear GATA-2 dose-related proliferation defect in adult bone marrow. Thus, GATA-2 plays at least two functionally distinct roles during ontogeny of HSCs: the production and expansion of HSCs in the aorta-gonad-mesonephros and the proliferation of HSCs in the adult bone marrow.


Figures

Figure 1.
Figure 1.
Strategy for studying HSCs and hematopoietic progenitor cells in GATA-2 mutant embryonic tissues. GATA-2 +/+, GATA-2 +/−, and GATA-2 −/− AGM regions, YS, and FL were harvested from midgestation mouse embryos. In some cases (left) they were then cultured for 3 d as whole tissue explants before preparation of single cell suspensions and injection into irradiated adult recipients to assay for CFU-S11 or HSCs. In some cases (right), single cell suspensions were prepared directly from freshly isolated tissues and injected into irradiated adult recipients for HSC activity.
Figure 2.
Figure 2.
CFU-S11 activity in GATA-2 mutant tissue explants. CFU-S11 were assayed from AGM, YS, and FL explants (E10.5–E12.0) after 3 d of culture. Each point represents the average CFU-S11 number per embryo tissue equivalent ± SEM detected in the corresponding tissue and genotype. 3–14 independent experiments were performed with 0.2–4.5 tissue equivalents injected per recipient. +/+, GATA-2 +/+; +/−, GATA-2 +/−. The total number of injected AGM explants: E10.5 +/+ = 6, E11.0 +/+ = 21, E11.5 +/+ = 14, E12.0 +/+ = 12, E10.5 +/− = 7, E11 +/− = 22, E11.5 +/− = 12, E12.0 +/− = 12; YS explants E10.5 +/+ = 8, E11.0 +/+ = 8, E11.5 +/+ = 11, E12.0 +/+ = 10.75, E10.5 +/− = 8, E11.0 +/− = 11.5, E11.5 +/− = 15.5, E12.0 +/− = 9.5; FL explants E11.0 +/+ = 17, E11.5 +/+ = 18, E12.0 +/+ = 8.7, E11.0 +/− = 23, E11.5 +/− = 19.5, E12.0 +/− = 8. Embryonic tissues from E10.5 ranged from 36 to 40 somite pairs (sp), E11.0 ranged from 41–47 sp, E11.5 contain >48 sp and E12 contained >60 sp. *Significant difference in the CFU-S11 number between GATA-2 +/+ and GATA-2 +/− tissue explants: AGM E11.0, P < 0.001; E11.5, P < 0.01; E12.0, P < 0.05; YS E11.5, P < 0.001; E12, P < 0.05. Note that fewer CFU-S11 are detected in both the GATA-2 +/− AGM and YS explants in comparison to the GATA-2 +/+ explants, whereas the FL CFU-S11 numbers are unaffected.
Figure 3.
Figure 3.
Detection of donor hematopoietic cell contribution in transplantation recipients by peripheral blood DNA PCR analysis. A representative PCR analysis for donor cell contribution to the peripheral blood of transplantation recipients. DNA was isolated from the corresponding recipients (at >4 mo posttransplantation) of GATA-2 +/+, GATA-2 +/−, and GATA-2 −/− AGM, YS, and FL. Lanes 1–8 and 9–14 are blood DNA samples isolated from recipients receiving cells from E12 GATA-2 +/+ and +/− tissues, respectively. Each sample was analyzed with primers specific for Y chromosome (ymt), and GATA-2 (GATA-2/NEO for targeted allele). DNA samples were normalized by PCR with two endogenous gene controls (myo, myogenin; GATA-2, wild-type allele). Control DNA: 0, 1, 10, and 100% represents percentage of the male GATA-2 +/− DNA mixed with female DNA. Only when the donor marker-specific PCR product was >10%, compared with controls, was the recipient considered to be positive.
Figure 4.
Figure 4.
Competitive transplantation of GATA-2 +/+ and GATA-2 +/− BM in sublethally irradiated adult recipients. Varying concentrations (3 × 10⁵–3 × 10⁷) of GATA-2 +/+ or GATA-2 +/− BM cells were transplanted into sublethally irradiated GATA-2 +/+ or GATA-2 +/− recipients to test for HSC competition in repopulation. The y axis shows the percentage of recipient animals engrafted with >10% donor cells in hematopoietic tissues. Engraftment results are shown in gray striped bars for GATA-2 +/+ donor cells transplanted into GATA-2 +/+ recipients, in gray bars for GATA-2 +/− donor cells transplanted into GATA-2 +/+ recipients, and in white bars for GATA-2 +/+ donor cells transplanted into GATA-2 +/−. The results show that GATA-2 +/+ HSCs out-compete GATA-2 +/− HSCs.
Figure 5.
Figure 5.
Phenotypic analysis of HSCs in GATA-2 +/− embryos and adults. GATA-2–Ly-6A GFP compound transgenic embryos were generated by timed pluggings. (A) Representative transverse sections through the E11 dorsal aorta of a GATA-2 + / + –Ly-6A GFP embryo (45 somite pairs; top) and a GATA-2 + / –Ly-6A GFP embryo (43 somite pairs; bottom). Sections were taken from the caudal end of the AGM, at the height of the hindgut, and stained with anti-CD34 antibody. In total, four embryos were analyzed (2 embryos and a total of 37 sections from each genotype) and cells counted in the aortic endothelium throughout the levels containing the gonads and mesonephroi. CD34+ endothelial cells served as a control for section quality and normalization. Red fluorescence (CD34) and green fluorescence (GFP). The percentage of GFP+/CD34+ endothelial cells ± SEM is shown on the bottom left and is significantly reduced in the GATA-2 +/− embryos; P < 0.05. Flow cytometric analysis of phenotypically defined HSCs was performed on (B) embryonic hematopoietic tissues and (C) adult BM. Expression of the Ly-6A GFP HSC marker was analyzed on E11 aorta, YS, and FL cells. Adult BM cells were analyzed for the percentage of cells in the Lin fraction that are Sca-1+c-kit+. Percentages of GFP+ cells in the embryonic tissue and Sca-1+c-kit+ cells enclosed in each gate are shown.
Figure 6.
Figure 6.
Hematopoietic regeneration after 5-FU treatment. The temporal regeneration of the hematopoietic system within the BM compartment of GATA-2 +/+ and GATA-2 +/− mice was examined at days 0, 4, 8, 12, and 16 after 5-FU injection for (A) total BM cell numbers, (B) the frequency of CFU-GM in 104 BM cells, and (C) the total number of CFU-GM in the BM (two tibias plus two femurs). The regeneration of BM HSCs was examined by quantification of the Sca-1+ and c-kit+ cells within the lin population by flow cytometry. (D) Percentage and (E) absolute number of LSK BM cells was examined at days 0, 4, 8, 12, and 16 after 5-FU injection. GATA-2 +/+ samples are represented by •, and GATA-2 +/− samples are represented by ○. Two complete time course experiments were performed. Each point represents an average of two to three animals with SEM. *Significant difference between the GATA-2 +/+ and GATA-2 +/−. (B) CFU-GM frequency day 12, P < 0.008. (C) CFU-GM numbers day 12, P < 0.002. (E) LSK cell number day 8 and 12, P < 0.04.

References

    1. Spangrude, G.J., L. Smith, N. Uchida, K. Ikuta, S. Heimfeld, J. Friedman, and I.L. Weissman. 1991. Mouse hematopoietic stem cells. Blood. 78:1395–1402. - PubMed
    1. Lemischka, I.R. 1991. Clonal, in vivo behavior of the totipotent hematopoietic stem cell. Semin. Immunol. 3:349–355. - PubMed
    1. Medvinsky, A., and E. Dzierzak. 1996. Definitive hematopoiesis is autonomously initiated by the AGM region. Cell. 86:897–906. - PubMed
    1. Muller, A.M., A. Medvinsky, J. Strouboulis, F. Grosveld, and E. Dzierzak. 1994. Development of hematopoietic stem cell activity in the mouse embryo. Immunity. 1:291–301. - PubMed
    1. de Bruijn, M.F., N.A. Speck, M.C. Peeters, and E. Dzierzak. 2000. Definitive hematopoietic stem cells first develop within the major arterial regions of the mouse embryo. EMBO J. 19:2465–2474. - PMC - PubMed

Publication types

MeSH terms