. 2004 Jul-Sep;5(3):185-98.
doi: 10.3348/kjr.2004.5.3.185.

Radiofrequency ablation of liver cancer: early evaluation of therapeutic response with contrast-enhanced ultrasonography

Affiliations

Radiofrequency ablation of liver cancer: early evaluation of therapeutic response with contrast-enhanced ultrasonography

Dongil Choi et al. Korean J Radiol. 2004 Jul-Sep.

Abstract

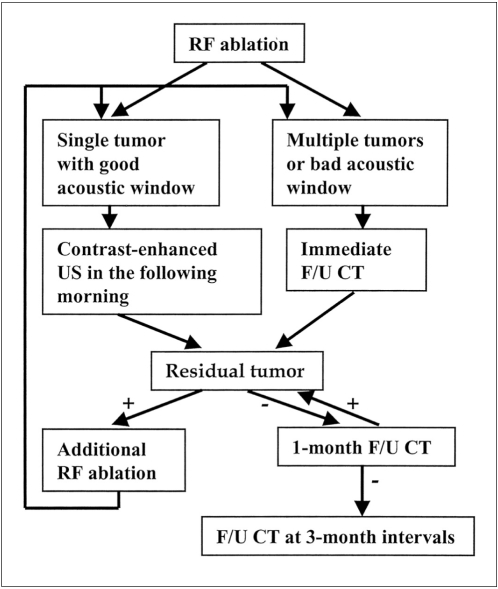
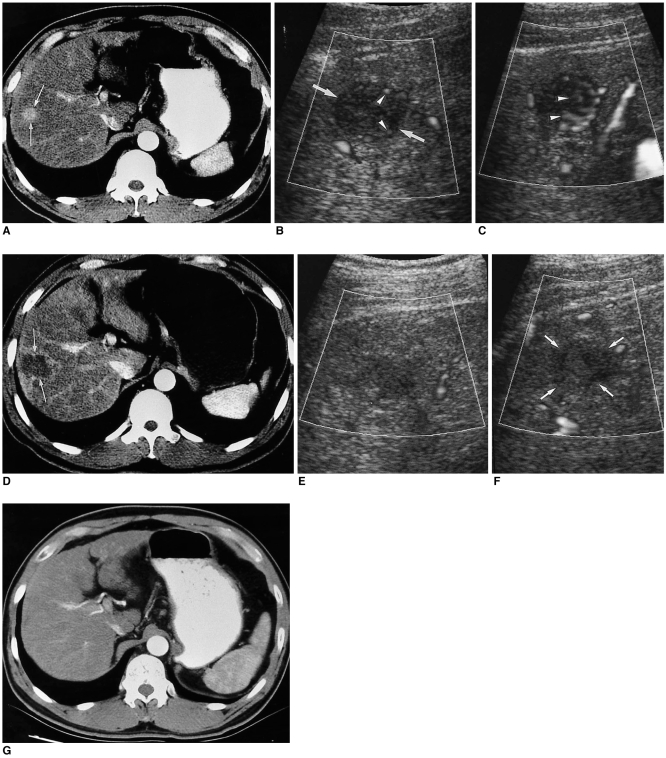
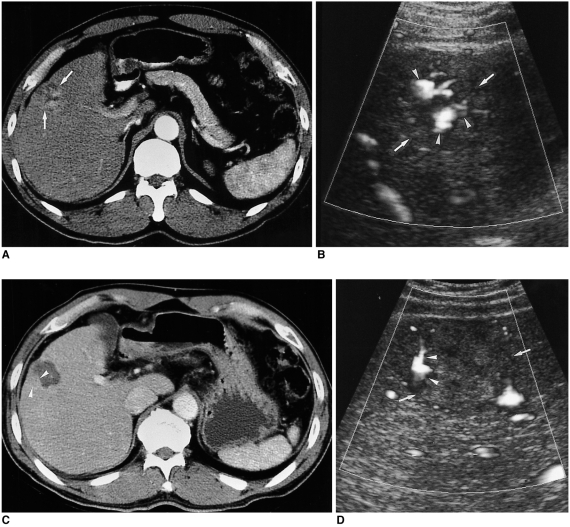
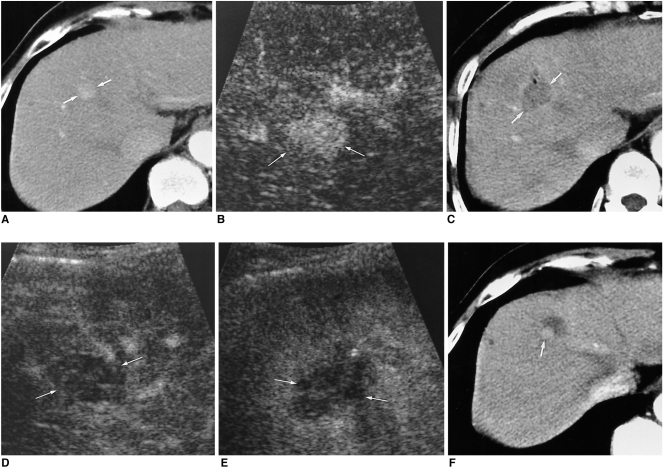
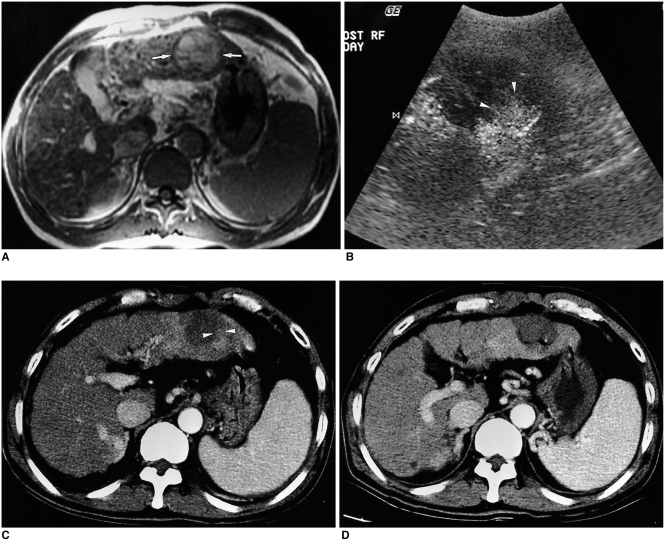
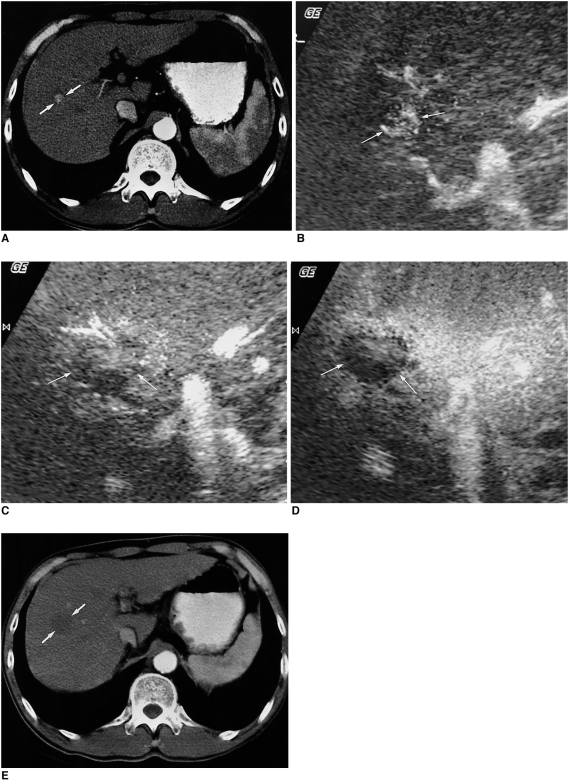
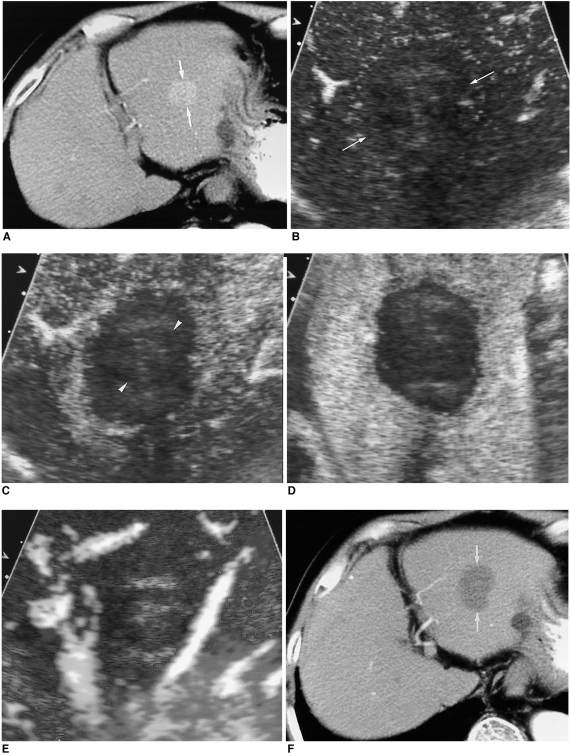
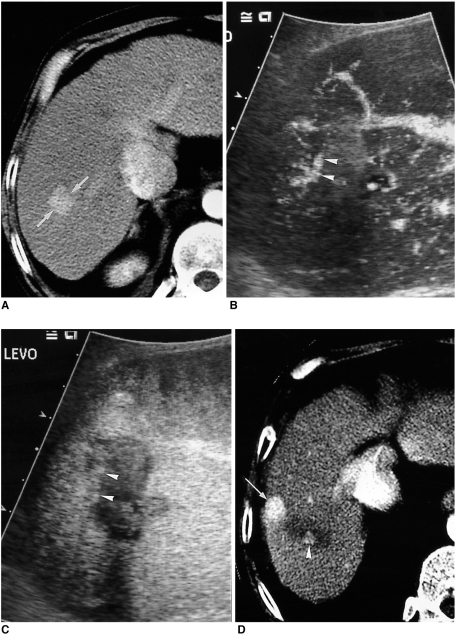
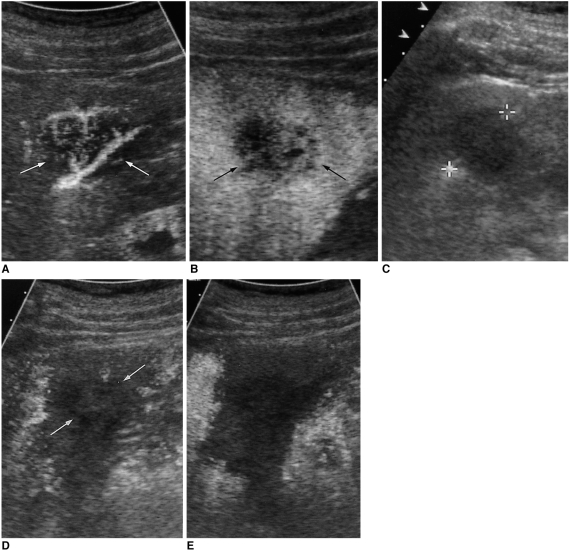
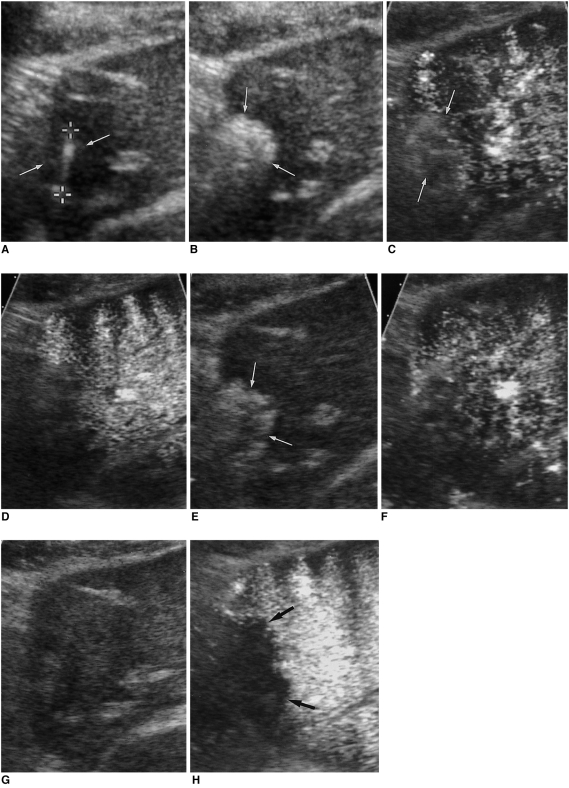
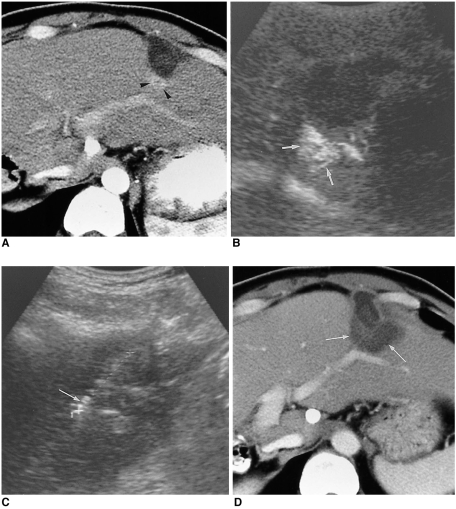
The early assessment of the therapeutic response after percutaneous radiofrequency (RF) ablation is important, in order to correctly decide whether further treatment is necessary. The residual unablated tumor is usually depicted on contrast-enhanced multiphase helical computed tomography (CT) as a focal enhancing structure during the arterial and portal venous phases. Contrast-enhanced color Doppler and power Doppler ultrasonography (US) have also been used to detect residual tumors. Contrast-enhanced gray-scale US, using a harmonic technology which has recently been introduced, allows for the detection of residual tumors after ablation, without any of the blooming or motion artifacts usually seen on contrast-enhanced color or power Doppler US. Based on our experience and reports in the literature, we consider that contrast-enhanced gray-scale harmonic US constitutes a reliable alternative to contrast-enhanced multiphase CT for the early evaluation of the therapeutic response to RF ablation for liver cancer. This technique was also useful in targeting any residual unablated tumors encountered during additional ablation.


Figures

Fig. 1
Fig. 1
Imaging strategy used to assess the therapeutic efficacy after radiofrequency ablation of liver cancer in our institution.
Fig. 2
Fig. 2
A 49-year-old-man with hepatocellular carcinoma before and after successful radiofrequency ablation. A. Contrast-enhanced CT obtained during the arterial phase before radiofrequency ablation shows a 2.0-cm hepatocellular carcinoma (arrows) with contrast enhancement in liver segment 8. B. Nonenhanced power Doppler US before radiofrequency ablation shows a few flow signals (arrowheads) in part of the hypoechoic tumor (arrows). C. Contrast-enhanced power Doppler US shows multiple flow signals (arrowheads) within the tumor. D. Contrast-enhanced CT obtained 20 minutes after radiofrequency ablation shows an ablation zone (arrows) of low attenuation, which represents the technical success of radiofrequency ablation. Note that the ablation zone is larger than the index tumor (i.e. the initially identified tumor prior to ablation). E. Nonenhanced power Doppler US performed 18 hours after radiofrequency ablation shows the hypoechoic ablation zone without flow signal. F. Contrast-enhanced power Doppler US again shows the ablation zone (arrows) without flow signal. G. On contrast-enhanced CT obtained 50 months after radiofrequency ablation, the ablation zone is no longer seen. The patient is still alive without recurrence.
Fig. 3
Fig. 3
A 53-year-old-man with hepatocellular carcinoma before and after radiofrequency ablation. A. Contrast-enhanced CT obtained during the arterial phase before radiofrequency ablation shows a 3.0-cm hepatocellular carcinoma (arrows) with contrast enhancement in segment 5. B. Contrast-enhanced power Doppler US before radiofrequency ablation shows multiple flow signals (arrowheads) within the index tumor (arrows). C. Contrast-enhanced CT after radiofrequency ablation shows that most of the ablation zone is of low attenuation, but a nodular enhancing focus (arrowheads) is noted in the posterior side of the ablation zone. This represents the residual unablated tumor portion. D. Contrast-enhanced power Doppler US shows peripheral flow signals (arrowheads) within the ablation zone (arrows), which represent the residual tumor vessels. The residual unablated tumor was treated with additional radiofrequency ablation.
Fig. 4
Fig. 4
A 58-year-old-woman with hepatocellular carcinoma before and after radiofrequency ablation. A. Contrast-enhanced CT obtained during the arterial phase before radiofrequency ablation shows a 2.0-cm hepatocellular carcinoma (arrows) with contrast enhancement in liver segment 8. B. Before radiofrequency ablation, contrast-enhanced pulse inversion harmonic imaging obtained at 30 sec-delay shows most portions of the tumor with contrast enhancement (arrows). C. Contrast-enhanced CT obtained during the arterial phase 30 minutes after radiofrequency ablation shows oval-shaped ablation zone (arrows) of low attenuation, which represents the technical success of radiofrequency ablation. D, E. After radiofrequency ablation, contrast-enhanced pulse inversion harmonic imaging obtained at 20 and 80 sec-delay shows no vascularity within the ablation zone (arrows). F. Contrast-enhanced CT obtained 7 months after radiofrequency ablation, however, shows a small nodular enhancing focus (arrow) at the peripheral margin of the ablation zone, which represents local tumor progression.
Fig. 5
Fig. 5
A 57-year-old man with hepatocellular carcinoma before and after radiofrequency ablation. A. Ferumoxides-enhanced T1-weighted fast multiplanar spoiled gradient-recalled echo image shows a 4.0-cm hepatocellular carcinoma (arrows) with high signal intensity in liver segment 3. B. After radiofrequency ablation, contrast-enhanced coded harmonic angio obtained at 30 sec-delay shows that most of the ablation zone is avascular without enhancement, but a nodular enhancing focus (arrowheads) is seen at the inner aspect of the ablation zone. The nodular enhancing portion represents the residual unablated tumor. C. Contrast-enhanced CT obtained 1 month after radiofrequency ablation shows that most of the ablation zone is of low attenuation, but a nodular enhancing portion (arrowheads) is seen at the posterior aspect of the ablation zone, which is identical to the location on US. D. Contrast-enhanced CT obtained 1 month after additional radiofrequency ablation shows a low attenuating ablation zone with the absence of contrast enhancement that represents technical success of radiofrequency ablation.
Fig. 6
Fig. 6
A 57-year-old-woman with hepatocellular carcinoma before and after successful radiofrequency ablation. A. Contrast-enhanced CT scan obtained during the arterial phase before radiofrequency ablation shows a 1.5-cm hepatocellular carcinoma (arrows) with contrast enhancement in liver segment 8. B. Contrast-enhanced coded harmonic angio before radiofrequency ablation shows most portions of the tumor with contrast enhancement (arrows). C. After radiofrequency ablation, contrast-enhanced coded harmonic angio obtained at 30 sec-delay shows no vascularity within the ablation zone (arrows). D. Acoustic emission imaging with a rapid sweeping technique at 80 sec-delay shows that all of the ablation zone is avascular without peripheral enhancement (arrows). E. Contrast-enhanced CT obtained 1 month after radiofrequency ablation shows a round ablation zone (arrows) of low attenuation, with the absence of contrast enhancement attesting to the technical success of the ablation.
Fig. 7
Fig. 7
A 72-year-old-man with hepatocellular carcinoma before and after successful radiofrequency ablation. A. Contrast-enhanced CT scan obtained during the arterial phase before radiofrequency ablation shows a 2.8-cm hepatocellular carcinoma (arrows) with contrast enhancement in liver segment 2. B. Contrast-enhanced agent detection imaging obtained at 18 sec-delay shows no vascularity within the ablation zone (arrows). C, D. Acoustic emission imaging with a rapid sweeping technique at 40 and 60 sec-delay shows that all of the ablation zone is avascular without peripheral enhancement. The index tumor (arrowheads) with a satisfactory cancer-free ablative margin of the ablation zone is noted. E. Contrast-enhanced power Doppler US again shows the ablation zone without flow signal. Some artifacts are also seen. F. Contrast-enhanced CT obtained 1 month after radiofrequency ablation shows a round ablation zone (arrows) of low attenuation with the absence of contrast enhancement attesting to the technical success of the ablation.
Fig. 8
Fig. 8
A 44-year-old-man with hepatocellular carcinoma before and after radiofrequency ablation. A. Contrast-enhanced CT scan before radiofrequency ablation shows a 2.5-cm hepatocellular carcinoma (arrows) with contrast enhancement in liver segment 7. B. In the morning following radiofrequency ablation, contrast-enhanced agent detection imaging obtained at a 20 sec-delay shows some flow signals (arrowheads) within the ablation zone. C. Acoustic emission imaging with a rapid sweeping technique at 80 sec-delay shows that most of the ablation zone is avascular without enhancement, but an irregular peripheral enhancing focus (arrowheads) representing the residual tumor is seen. D. Contrast-enhanced CT obtained 1 month after radiofrequency ablation shows a small enhancing focus (arrowhead) at the superior margin of the ablation zone. Note the presence of another small enhancing area representing an iatrogenic arterioportal shunt (arrow) due to the ablation procedure.
Fig. 9
Fig. 9
A 74-year-old-man with hepatic metastasis from colon cancer before and after radiofrequency ablation. A, B. Contrast-enhanced agent detection imaging obtained at 20 and 70 sec-delay shows a 2.5-cm metastatic tumor (arrows) with internal vascularity and irregular rim-like enhancement. C. US shows an electrode placement within the index tumor. D. The following morning, 19 hours after radiofrequency ablation, contrast-enhanced agent detection imaging obtained at 25 sec-delay shows the index tumor (arrows) and no vascularity within the ablation zone. E. Acoustic emission imaging with a rapid sweeping technique at 60 sec-delay shows that all the ablation zone is avascular without peripheral enhancement.
Fig. 10
Fig. 10
A 70-year-old-man with hepatocellular carcinoma. A. US shows the active tip of the radiofrequency electrode (between electronic calipers) within the index tumor (arrows). B. US obtained immediately after radiofrequency ablation shows hyperechogenicity (arrows) in the ablation zone. C, D. Immediately after radiofrequency ablation, contrast-enhanced agent detection imaging obtained at 30 and 90 sec-delay show that hyperechogenicity in the ablation zone (arrows) makes it difficult to depict any residual tumor. E. The hyperechogenicity (arrows) has persisted 20 minutes after radiofrequency ablation. F. On contrast-enhanced agent detection imaging 20 minutes after radiofrequency ablation, it is not easy to evaluate the therapeutic efficacy. G. The following morning, 18 hours after radiofrequency ablation, the hyperechogenicity is no longer seen in the ablation zone. H. Acoustic emission imaging with a rapid sweeping technique at 80 sec-delay shows no vascularity within the ablation zone (arrows).
Fig. 11
Fig. 11
A 49-year-old-man with hepatocellular carcinoma. A. Contrast-enhanced CT obtained during the arterial phase after first radiofrequency ablation shows a 0.8-cm residual tumor (arrowheads) in the posterior aspect of the ablation zone. B. Contrast-enhanced coded harmonic angio before additional radiofrequency ablation shows a discrete enhancing area, representing the residual tumor (arrows). C. Under contrast-enhanced coded harmonic angio guidance, the electrode (arrow) is inserted into the residual tumor portion. D. Contrast-enhanced CT obtained 1 month after additional radiofrequency ablation shows a large ablated zone (arrows) including the residual tumor.

Similar articles

Cited by

References

    1. Dodd GD, 3rd, Soulen MC, Kane RA, et al. Minimally invasive treatment of malignant hepatic tumors: at the threshold of a major breakthrough. RadioGraphics. 2000;20:9–27. - PubMed
    1. Livraghi T, Goldberg SN, Lazzarni S, Meloni F, Solbiati L, Gazelle GS. Small hepatocellular carcinoma: treatment with radio-frequency ablation versus ethanol injection. Radiology. 1999;210:655–661. - PubMed
    1. Gazelle GS, Goldberg SN, Solbiati L, Livraghi T. Tumor ablation with radio-frequency energy. Radiology. 2000;217:633–646. - PubMed
    1. Lim HK. Radiofrequency thermal ablation of hepatocellular carcinomas. Korean J Radiol. 2000;1:175–184. - PMC - PubMed
    1. McGahan JP, Dodd GD., 3rd Radiofrequency ablation of the liver: current status. AJR Am J Roentgenol. 2001;176:3–16. - PubMed