. 2004 Oct;114(7):979-87.
doi: 10.1172/JCI20483.

Costimulation controls diabetes by altering the balance of pathogenic and regulatory T cells

Affiliations

Costimulation controls diabetes by altering the balance of pathogenic and regulatory T cells

Hélène Bour-Jordan et al. J Clin Invest. 2004 Oct.

Abstract

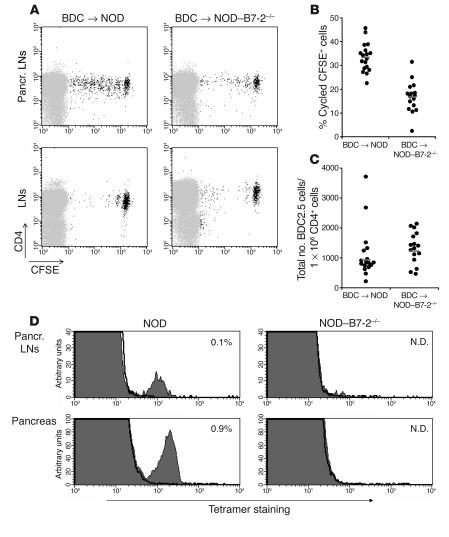
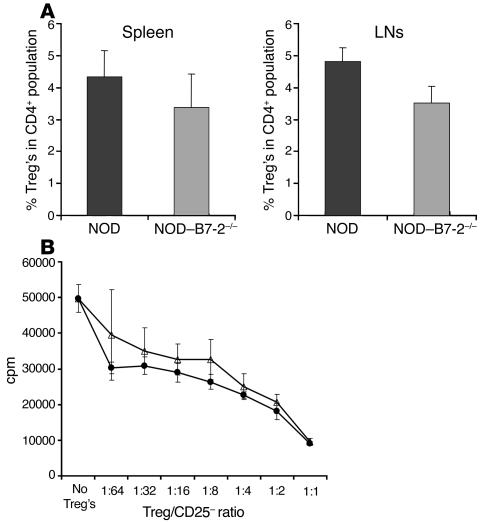
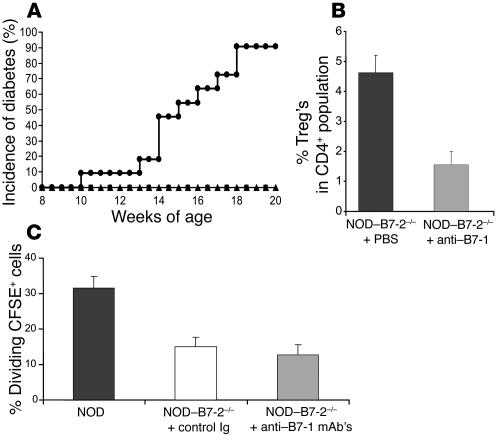
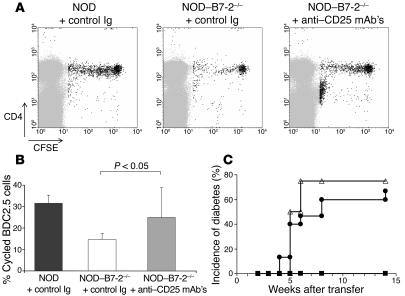
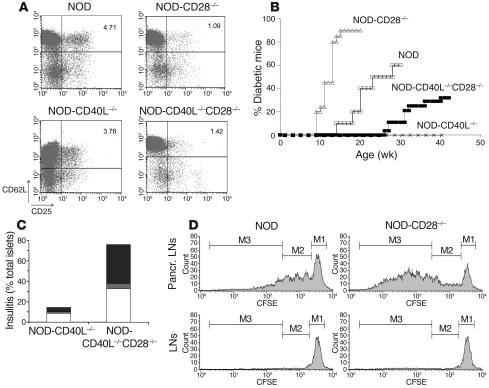
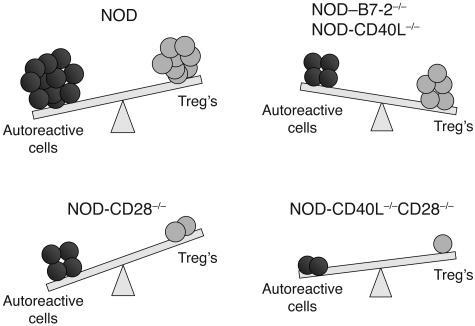
The development of autoimmune diabetes in the nonobese diabetic (NOD) mouse results from a breakdown in tolerance to pancreatic islet antigens. CD28-B7 and CD40 ligand-CD40 (CD40L-CD40) costimulatory pathways affect the development of disease and are promising therapeutic targets. Indeed, it was shown previously that diabetes fails to develop in NOD-B7-2-/- and NOD-CD40L-/- mice. In this study, we examined the relative role of these 2 costimulatory pathways in the balance of autoimmunity versus regulation in NOD mice. We demonstrate that initiation but not effector function of autoreactive T cells was defective in NOD-B7-2-/- mice. Moreover, the residual proliferation of the autoreactive cells was effectively controlled by CD28-dependent CD4+CD25+ regulatory T cells (Treg's), as depletion of Treg's partially restored proliferation of autoreactive T cells and resulted in diabetes in an adoptive-transfer model. Similarly, disruption of the CD28-B7 pathway and subsequent Treg deletion restored autoimmunity in NOD-CD40L-/- mice. These results demonstrate that development of diabetes is dependent on a balance of pathogenic and regulatory T cells that is controlled by costimulatory signals. Thus, elimination of Treg's results in diabetes even in the absence of costimulation, which suggests a need for alternative strategies for immunotherapeutic approaches.


Figures

Figure 1
Figure 1
B7-2 deficiency alters the initial activation of diabetogenic T cells. (A) We sorted BDC2.5 T cells, labeled them with CFSE, and transferred 1 × 10⁶ cells into NOD (left panels) or NOD_B7-2_/_ (right panels) recipients. After 2 weeks, we examined BDC2.5 T cell proliferation in pancreatic LNs (top panels) and peripheral LNs (bottom panels). Similar results were observed in peripheral LNs and spleen (data not shown). A representative experiment is shown. Pancr., pancreatic. (B) The results of 5 separate experiments performed as described in A are shown. We expressed the results as the percentage of cycled CFSE+ cells in the pancreatic LNs calculated as: (number of cycled CFSE+ cells/total number of cycled and noncycled CFSE+ cells) × 100. Each circle represents an individual mouse. Horizontal bars represent the mean value for each group. (C) We compared the total number of BDC2.5 CFSE+ cells (normalized to the number of endogenous CD4+ cells) recovered in the pancreatic LNs in NOD (n = 17) and NOD_B7-2_/_ (n = 16) recipients. Each circle represents an individual mouse. Horizontal bars represent the geometric mean. There was no statistical difference in the total number of BDC2.5 cells in the pancreatic LNs in NOD and NOD_B7-2_/_ mice (t test using geometric mean, P > 0.05). Similar results were observed in peripheral LNs (data not shown). (D) Single-cell suspensions from pancreatic LNs and pancreas of 16- to 18-week-old NOD and NOD_B7-2_/_ mice were stained with CD8 and NRP-V7-H-2Kd tetramers. Results display NRP-V7-H-2Kd tetramer (filled histogram) and TUM-H-2Kd control tetramer (bold line) staining. The percentage of CD8+ tetramer+ cells within the mononuclear cell population was indicated. N.D., not detected.
Figure 2
Figure 2
Normal Treg function in NOD_B7-2_/_ mice. (A) NOD_B7-2_/_ mice have reduced percentage of Treg. We analyzed by flow cytometry the percentage of CD25+CD62LhiTreg within the CD4+ population in NOD spleen (n = 13) and LNs (n = 11) and NOD_B7-2_/_ spleen (n = 11) and LNs (n = 9). The percentage of Treg’s was slightly but significantly reduced in NOD_B7-2_/_ mice (t test, P = 0.01 in spleen and P < 0.00001 in LNs). (B) NOD and NOD_B7-2_/_ Treg’s suppress with similar efficiency in vitro. We purified CD4+CD25+CD62Lhi Treg’s from spleen and LNs of NOD (open triangles) and NOD_B7-2_/_ (filled circles) mice. Decreasing numbers of Treg’s were added to CD4+CD25_CD62Lhi T cells stimulated with anti-CD3 mAb’s and APCs, and proliferation was measured by incorporation of 3H-thymidine.
Figure 3
Figure 3
Blocking B7-1 but not CTLA-4 restores diabetes in NOD_B7-2_/_ mice. (A) We treated NOD_B7-2_/_ mice with control Ig (triangles; n = 5), anti_B7-1 mAb’s (circles; n = 11), or anti_CTLA-4 mAb’s (squares; n = 8). We followed blood glucose levels weekly after mice reached 8 weeks of age to assess the development of diabetes. Similar results were observed in males and females and were pooled. The incidence of diabetes was 0% in both control Ig and anti_CTLA-4 mAb_treated groups. (B) NOD_B7-2_/_ mice were treated with anti_B7-1 mAb’s between 2 and 4 weeks of age. Percentage of Treg’s was analyzed 2_4 days after the end of the treatment. (C) BDC2.5 cells labeled with CFSE were transferred into adult (8- to 10-week-old) NOD mice or NOD_B7-2_/_ mice treated with control Ig or anti_B7-1 mAb’s. NOD_B7-2_/_ mice were treated with 7 injections of 50 μg anti_B7-1 mAb’s every other day using two different regimens (see Methods for details). The 2 groups gave similar results and were pooled. The results are expressed as the percentage of cycled BDC2.5 cells in the pancreatic LNs (see Figure 1 legend). Histograms represent the mean and standard deviation for each group.
Figure 4
Figure 4
Treg’s suppress autoreactive T cell activation in NOD_B7-2_/_ mice. NOD_B7-2_/_ recipients were thymectomized to avoid rapid repopulation of the peripheral Treg compartment by CD4+CD25+ Treg’s emigrating from the thymus (46) and then treated with anti-CD25 mAb’s to deplete Treg’s. Moreover, the adoptive transfer of purified naive BDC2.5 T cells was delayed 2 weeks after anti-CD25 treatment to allow the antibody to clear from the circulation. (A) NOD mice were treated with control Ig (left) and NOD_B7-2_/_ mice were treated with control Ig (middle) or anti-CD25 mAb’s (PC61) (right). Transfer of BDC2.5 cells and analysis in the pancreatic LNs was as described in Figure 1A. A representative experiment is shown. (B) The results of 3 separate experiments performed as described in A are shown. Percentage of cycled CFSE+ cells in the pancreatic LNs was calculated as in Figure 1B in NOD, NOD_B7-2_/_, and NOD_B7-2_/_ depleted of Treg’s. Each histogram represents the mean and standard deviation of each group. The P value for the t test between the relevant groups is shown. The same result was obtained when comparing geometric means instead of means (t test, P < 0.05). (C) We depleted Treg’s from NOD or NOD_B7-2_/_ spleen cells using anti-CD25 mAb’s (7D4) and rabbit complement. We transferred total spleen cells from NOD_B7-2_/_ mice (filled squares; n = 5) or CD25-depleted spleen cells from NOD mice (open triangles; n = 4) or NOD_B7-2_/_ mice (filled circles; n = 9) into NOD-SCID recipients. We followed blood glucose levels weekly after transfer to assess the development of diabetes.
Figure 5
Figure 5
CD28 and CD40L differentially affect diabetes in NOD mice. (A) We developed NOD mice deficient for CD28 (NOD-CD28_/_), CD40L (NOD-CD40L_/_), or both CD40L and CD28 (NOD-CD40L_/_CD28_/_). We compared the number of Treg’s in these different strains. The results are displayed as CD62L (y axis) versus CD25 (x axis) staining and are gated on the CD4+ population. One out of 3 representative experiments is shown. (B) We compared the incidence of diabetes in NOD (open squares), NOD-CD28_/_ (open triangles), NOD-CD40L_/_ (x’s) and NOD-CD40L_/_CD28_/_ (filled squares) mice. (C) We performed histological analysis of the pancreas in NOD-CD40L_/_ and NOD-CD40L_/_CD28_/_ mice and scored the severity of insulitis as peri-insulitis (white bars), moderate insulitis (gray bars) and severe insulitis (black bars) in NOD-CD40L_/_ and NOD-CD40L_/_CD28_/_ mice (70 and 37 islets were scored, respectively). (D) CD25-depleted BDC2.5-CD90.1 T cells were labeled with CFSE and transferred into NOD or NOD-CD28_/_ mice. Four days later, the proliferation of BDC2.5 cells was assessed in the pancreatic LNs. The histograms are gated on CD4+ CD90.1+ cells, and the 3 regions M1_M3 indicate undivided cells, cells that underwent 1 to 3 divisions, and cells that underwent 4 or more divisions, respectively.
Figure 6
Figure 6
Autoimmune diabetes is controlled by a costimulation-dependent balance of pathogenic and regulatory T cells. In NOD mice, which are genetically prone to autoimmunity, autoreactive T cells dominate Treg’s, leading to development of autoimmune diabetes. In the absence of B7-2 or CD40L, Treg’s are marginally reduced, whereas activation of autoreactive T cells is profoundly affected, resulting in the absence of diabetes. In contrast, in the absence of CD28 signals, the deficit in Treg’s is so severe that disease develops with accelerated kinetics and increased severity. Finally, in the absence of CD28 and CD40L signals, both diabetogenic T cells and Treg’s are affected, but the absence of CD28-dependent Treg’s appears dominant and results in insulitis and diabetes, thus bypassing the need for the two major costimulatory pathways in the development of the autoimmune process.

References

    1. Delovitch TL, Singh B. The nonobese diabetic mouse as a model of autoimmune diabetes: immune dysregulation gets the NOD. Immunity. 1997;7:727–738. - PubMed
    1. Hoglund P, et al. Initiation of autoimmune diabetes by developmentally regulated presentation of islet cell antigens in the pancreatic lymph nodes. J. Exp. Med. 1999;189:331–339. - PMC - PubMed
    1. Bach JF. Immunotherapy of type 1 diabetes: lessons for other autoimmune diseases. Arthritis Res. 2002;4:S3–S15. - PMC - PubMed
    1. Salomon B, Bluestone JA. Complexities of CD28/B7: CTLA-4 costimulatory pathways in autoimmunity and transplantation. Annu. Rev. Immunol. 2001;19:225–252. - PubMed
    1. Lenschow DJ, et al. Differential effects of anti-B7-1 and anti-B7-2 monoclonal antibody treatment on the development of diabetes in the nonobese diabetic mouse. J. Exp. Med. 1995;181:1145–1155. - PMC - PubMed

MeSH terms