. 2004 Oct 15;173(8):4779-90.
doi: 10.4049/jimmunol.173.8.4779.

Rebuilding an immune-mediated central nervous system disease: weighing the pathogenicity of antigen-specific versus bystander T cells

Affiliations

Rebuilding an immune-mediated central nervous system disease: weighing the pathogenicity of antigen-specific versus bystander T cells

Dorian B McGavern et al. J Immunol. .

Abstract

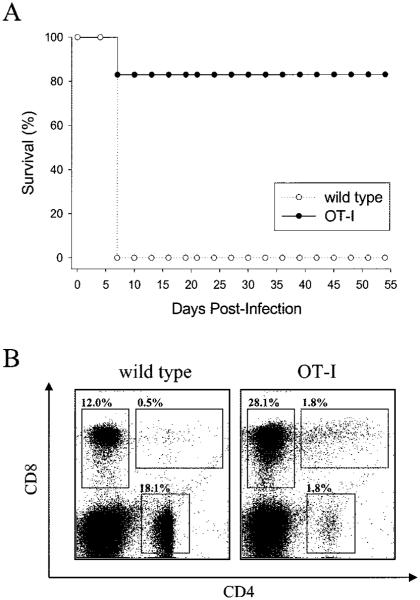
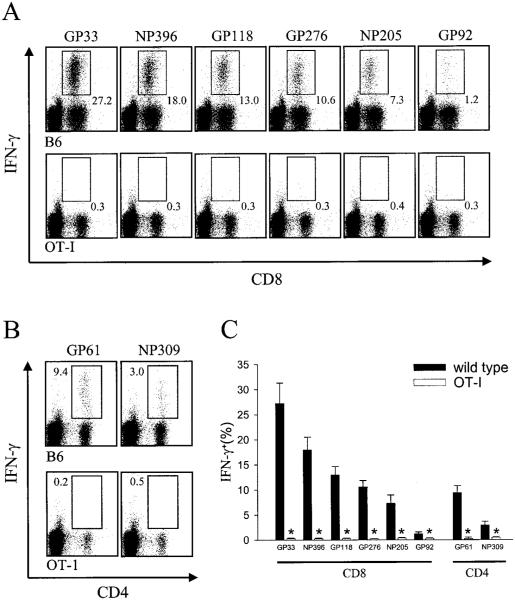
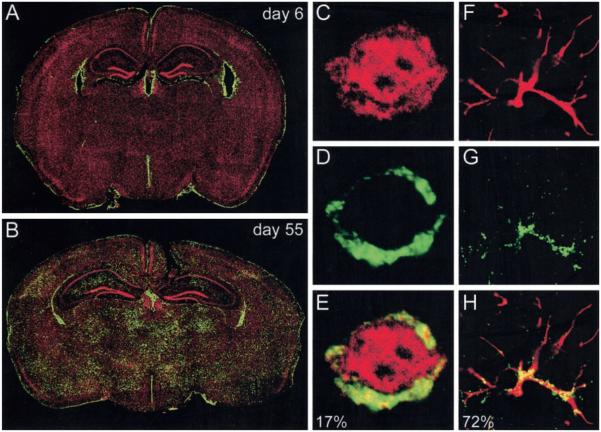
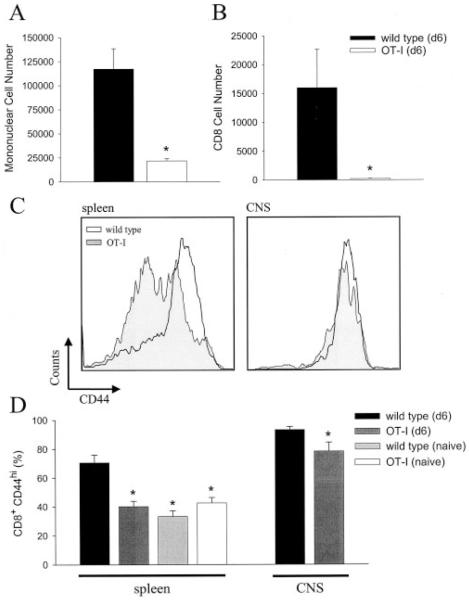
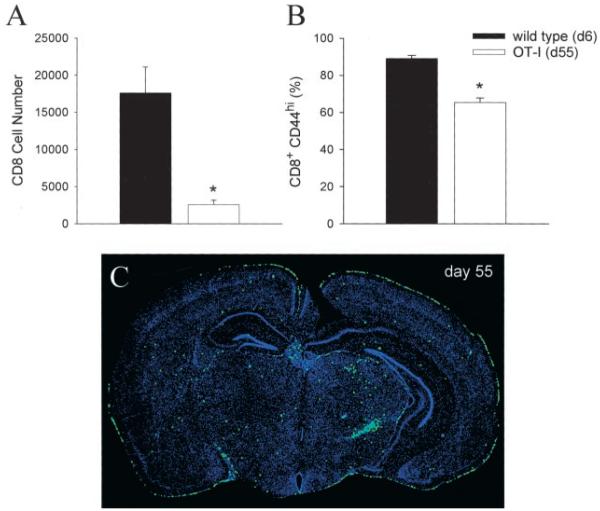
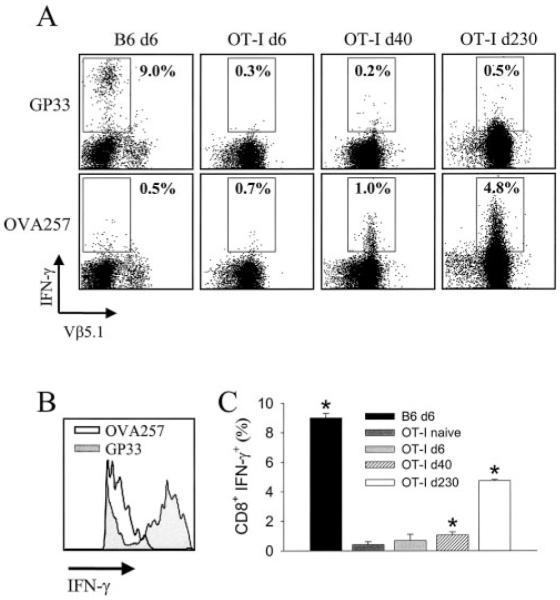
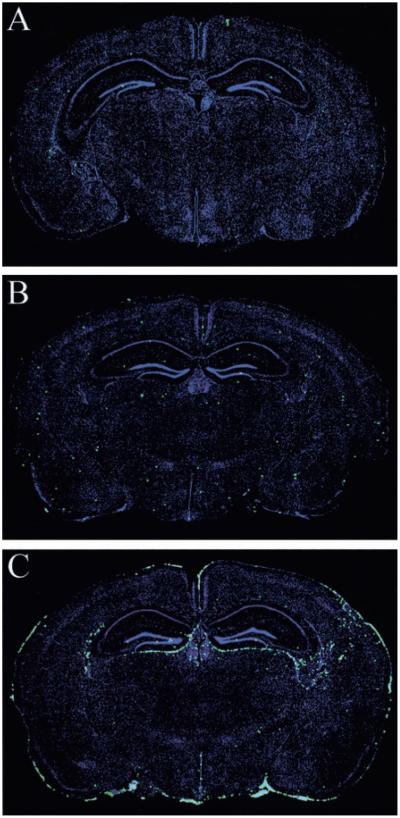
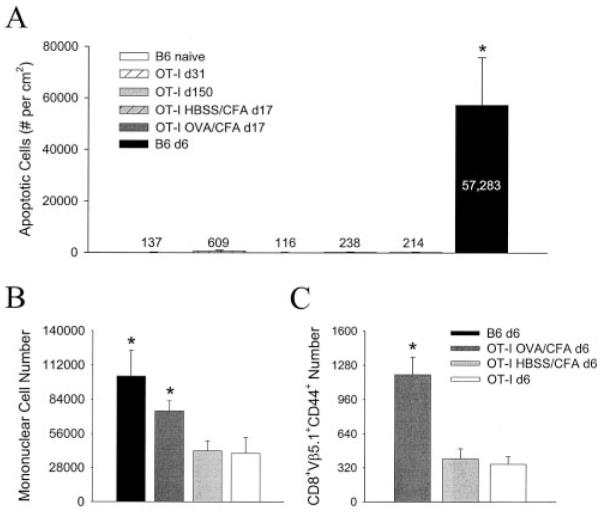
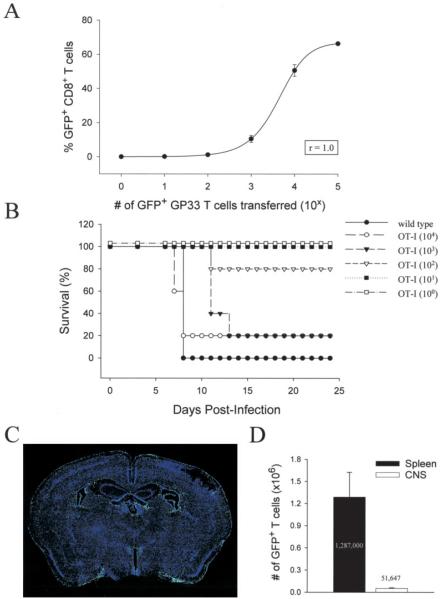
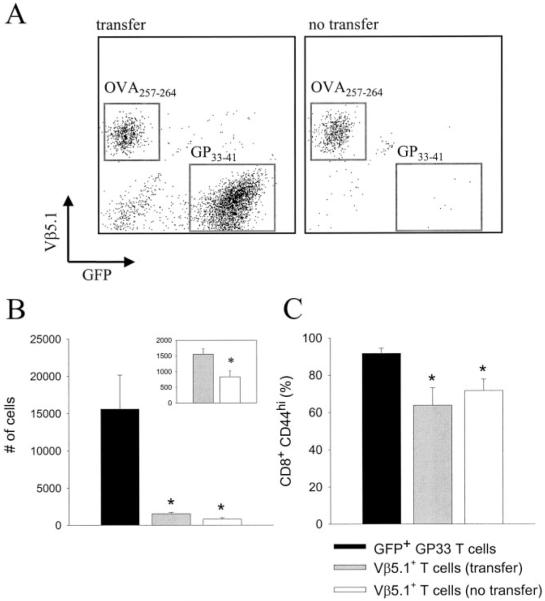
Although both self- and pathogen-specific T cells can participate in tissue destruction, recent studies have proposed that after viral infection, bystander T cells of an irrelevant specificity can bypass peptide-MHC restriction and contribute to undesired immunopathological consequences. To evaluate the importance of this mechanism of immunopathogenesis, we determined the relative contributions of Ag-specific and bystander CD8+ T cells to the development of CNS disease. Using lymphocytic choriomeningitis virus (LCMV) as a stimulus for T cell recruitment into the CNS, we demonstrate that bystander CD8+ T cells with an activated surface phenotype can indeed be recruited into the CNS over a chronic time window. These cells become anatomically positioned in the CNS parenchyma, and a fraction aberrantly acquires the capacity to produce the effector cytokine, IFN-gamma. However, when directly compared with their virus-specific counterparts, the contribution of bystander T cells to CNS damage was insignificant in nature (even when specifically activated). Although bystander T cells alone failed to cause tissue injury, transferring as few as 1000 naive LCMV-specific CD8+ T cells into a restricted repertoire containing only bystander T cells was sufficient to induce immune-mediated pathology and reconstitute a fatal CNS disease. These studies underscore the importance of specific T cells in the development of immunopathology and subsequent disease. Because of highly restrictive constraints imposed by the host, it is more likely that specific, rather than nonspecific, bystander T cells are the active participants in T cell-mediated diseases that afflict humans.


Figures

FIGURE 1
FIGURE 1
Analysis of survival and the peripheral T cell compartment in OT-I mice. Wild-type (n = 5) and OT-I mice (n = 5) were infected intracerebrally with 103 PFU of LCMV Arm and monitored for survival. The plot in A illustrates an observation period of 55 days, which is representative of the entire 150-day window of the study. The OT-I curve shows that one of the five mice succumbed to the intracerebral challenge. This probably resulted from the intracerebral injection procedure, because no additional OT-I mice succumbed to infection in subsequent experiments (see Fig. 9B for examples). PBMC harvested from uninfected wild-type and OT-I mice were analyzed flow cytometrically to establish the frequency of CD8+, CD4+, and CD8+CD4+ cells in the T cell compartment (B). Gray boxes are used to highlight each of the aforementioned T cell populations. Note the significant skewing of the repertoire in OT-I mice: 28% CD8+ and only 1.8% CD4+.
FIGURE 2
FIGURE 2
Quantification of the LCMV-specific T cell response in wild-type vs OT-I mice. Splenocytes from wild-type (n = 4) and OT-I (n = 4) mice infected i.p. with 105 PFU of LCMV Arm were analyzed on day 8 postinfection for CD8+ (A) or CD4+ (B) T cell responses to eight known class I- and class II-restricted peptides that map to the NP and glycoprotein (GP) of LCMV Arm (see Materials and Methods). The peptides are shown in order of immunodominance. Splenocytes were incubated in the presence of the indicated peptides for5h in vitro and then were analyzed for the production of IFN-γ. A summation of the results is shown in C. Data are represented as the mean ± SD. Statistical differences denoted by asterisks were determined using Student’s t test (p < 0.05).
FIGURE 3
FIGURE 3
Evaluation of viral tropism in OT-I mice. Six-micron coronal brain sections from OT-I mice on day 6 (n = 3; A) and day 55 (n = 3; B) postinfection were stained with a polyclonal anti-LCMV Ab (green) and a nuclear dye (red). Brain reconstructions were performed to illustrate the anatomical distribution of LCMV. On day 6 after an intracerebral inoculation, LCMV localizes to the meninges, ependyma, and choriod plexus. At later time points, the virus also establishes persistence in the brain parenchyma. C–H, High resolution analyses of LCMV-infected cells (green; D and G) that colocalize with neuronal (red; C) or astrocyte (red; GFAP; F) staining on day 55 postinfection. Overlapping fluorescence illustrated in the merged panels (E and H) appears in yellow. The percentages shown on the merged images indicate the frequency of LCMV-infected cells that can be accounted for by neuronal (17%) or astrocyte staining (73%).
FIGURE 4
FIGURE 4
Quantitative analysis of bystander T cell trafficking to the brain. The total number of mononuclear cells (A) and CD8+ T cells (B) residing in the brain was determined for wild-type (n = 5) and OT-I (n = 4) mice on day 6 postinfection (d6). Statistical differences denoted by asterisks were determined using Student’s t test (p < 0.05). Flow cytometric analyses were used to evaluate the expression of CD44 on CD8+ T cells obtained from the spleen or brain of mice at the indicated time point (C and D). A representative histogram gated on CD8+ T cells is shown for both tissue compartments (C). A summation of the results that illustrates the percentage of CD8+ T cells deemed CD44high is shown in D. For splenic CD8+ T cells, CD44 expression was compared statistically by one-way ANOVA (p < 0.05) using the values obtained from uninfected wild-type (n = 4), uninfected OT-I (n = 4), day 6 wild-type (n = 5), and day 6 OT-I (n = 4) mice. Asterisks indicate a statistically significant reduction compared with day 6 wild-type mice. Uninfected wild-type and day 6 OT-I mice were not statistically different from one another. Because no CD8+ T cells were extracted from the brains of uninfected mice, analysis of CD44high expression on brain-infiltrating CD8+ T cells was restricted to infected wild-type and OT-I mice. Compared with wild-type mice, a slight reduction in the percentage of CD8+CD44high T cells was observed in OT-I mice; however, this percentage was significantly higher than that in the splenic compartment (p < 0.05).
FIGURE 5
FIGURE 5
Enumeration and anatomical localization of bystander T cells in persistently infected OT-I mice. The total number of brain-infiltrating CD8+ T cells (A) as well the percentage of CD8+CD44high T cells (B) were compared between acutely infected (day 6 (d6)) wild-type mice (n = 5) and persistently infected (day 55 (d55)) OT-I mice (n = 5). Statistical differences denoted by asterisks were determined using Student’s t test (p < 0.05). The anatomical distribution of CD8+ T cells in persistently infected OT-I mice (n = 3) was evaluated by performing reconstructions of 6-μm coronal brain sections stained with an anti-CD8 Ab (green) and a nuclear dye (blue). Anti-CD8 (instead of a Vβ5.1) Ab was used because flow cytometric analyses revealed that >90% of brain-infiltrating CD8+ T cells at this time point coexpressed Vα2 and Vβ5.1, confirming that they were KbOVA257–264 specific. A representative coronal brain reconstruction is shown in C. The diameter of each green dot, which represents an individual CD8+ T cell, was digitally enhanced by one pixel to facilitate visualization of these cells on the reconstruction.
FIGURE 6
FIGURE 6
Analysis of IFN-γ production by bystander T cells. Splenocytes from intracerebrally inoculated wild-type (day 6 (d6); n = 3), OT-I (d6; n = 4), OT-I (d40; n = 3), and OT-I (d230; n = 3) mice were analyzed for the ability to produce IFN-γ after a 5-h in vitro stimulation with either gp33–41 or OVA257–264 peptide. Representative flow cytometric plots gated on CD8+ T cells are shown in A. The percentage of CD8+ T cells that produce IFN-γ in response to the indicated peptide is shown on each plot (■). Vβ5.1 expression was evaluated to ensure that the CD8+ T cells analyzed from OT-I mice were, in fact, KbOVA257–264 specific. B, Representative histogram (gated on CD8+ T cells) comparing the intensity of IFN-γ production between Dbgp33–41-specific (d6) and KbOVA257–264-specific (d40) T cells. C, Summary of the percentage of IFN-γ expressing CD8+ T cells to cognate peptide shown in A. This panel also includes uninfected OT-I (n = 3) mice as a control. Asterisks denote a statistical difference, as determined by Student’s t test (p < 0.05), between cells stimulated with cognate vs irrelevant peptide. For example, a statistically significant increase in IFN-γ production was observed for OT-I mice on d40 when OVA257–264 peptide (cognate) was compared with gp33–41 (irrelevant).
FIGURE 7
FIGURE 7
Apoptosis in the brains of infected wild-type and OT-I mice. An ApopTag detection kit (see Materials and Methods) was used to visualize apoptotic cells (green) on 6-μm frozen brain sections from uninfected wild-type (n = 3; A), day 31 after infection (d31) OT-I (n = 3; B), and d6 wild-type (n = 5; C) mice. Sections were counterstained with a nuclear dye (blue). The diameter of each green dot, which represents an individual apoptotic cell, was digitally enhanced by 1 pixel to facilitate visualization of these cells on the reconstruction. Note the marked increase in the number of apoptotic cells in the brain of symptomatic B6 mice on d6 after an intracerebral infection.
FIGURE 8
FIGURE 8
Quantitative analysis of apoptosis and bystander T cell recruitment in the brains of infected wild-type and OT-I mice. A, Number of apoptotic cells per square centimeter quantified on coronal brain reconstructions (see Fig. 7 for examples) using an image analysis program (see Materials and Methods). The data are represented as the mean ± SD for the following experimental groups: uninfected wild-type (n = 3), day 31 of infection (d31) OT-I (n = 3), d150 OT-I (n = 3), d17 HBSS/CFA OT-I (n = 4), d17 OVA/CFA OT-I (n = 3), and d6 wild-type (n = 5). Numbers on the graph denote the mean for each group. Similar results were obtained when OT-I mice were analyzed on d55. B and C, Absolute number of mononuclear (B) and activated (i.e., CD44+) KbOVA257–264-specific T cells (C) in CNS of the indicated groups on d6 postinfection. Vβ5.1 expression was evaluated in C to ensure that the CD8+ T cells analyzed from the CNS of OT-I mice were, in fact, KbOVA257–264 specific. Data are represented as the mean ± SD. Statistical differences between all groups (denoted by asterisks) were determined by one-way ANOVA (p < 0.05).
FIGURE 9
FIGURE 9
Reconstitution of acute disease in OT-I mice. A, The perfect sigmoidal relationship (r = 1.0) between the number of naive GFP+Dbgp33–41-specific CD8+ T cells injected and the magnitude of the virus-specific immune response on day 8 after an i.p. infection of wild-type mice with 105 PFU of LCMV Arm. Two days before infection, mice received log-serial dilutions of naive GFP+Dbgp33–41-specific CD8+ T cells ranging from 105–100. B, Survival curve of OT-I mice (n = 5/group) reconstituted with log-serial dilutions of naive GFP+Dbgp33–41-specific CD8+ T cells ranging from 104–100. Wild-type mice (n = 5) served as a positive control for this experiment. Two days after the adoptive transfer, mice received intracerebral infection with 103 PFU of LCMV Arm. C, Representative example (n = 3) of a coronal brain reconstruction from a symptomatic OT-I mouse (day 8) receiving the minimum number of naive GFP+Dbgp33–41-specific CD8+ T cells (i.e., 103) required to reconstituted disease. Green dots represent individual GFP+Dbgp33–41-specific CD8+ T cells in the brain. Sections were costained with a nuclear dye (blue). D, Quantification of the absolute number of GFP+Dbgp33–41-specific CD8+ T cells present in the spleen and CNS of symptomatic OT-I mice (n = 4) on day 8 postinfection, receiving the minimum number of cells required to reconstitute disease. Data are represented as the mean ± SD. The average for each tissue is shown on the graph.
FIGURE 10
FIGURE 10
The influence of Dbgp33–41-specific T cells on bystander T cell recruitment and activation. Representative dot plots of brain-infiltrating leukocytes (gated on CD8) from OT-I mice receiving no transfer (n = 5) or a transfer of 104 GFP+Dbgp33–41-specific CD8+ T cells (n = 5) are shown in A. Both groups (day 7 postinfection) received intracerebral infection with 103 PFU of LCMV Arm. Note the absence of GFP+ T cells in mice not receiving a transfer, whereas the Vβ5.1-expressing bystander T cell population is roughly equivalent in both groups. B, Quantification of the absolute number of brain-infiltrating GFP+ (transfer recipients only) and Vβ5.1+ (transfer vs no transfer) CD8+ T cells. Data are represented as the mean ± SD. Asterisks denote a statistically significant decrease (as determined by one-way ANOVA, p < 0.05) from the number of GFP+ T cells in the brain. B, Inset, The number of Vβ5.1+ T cells on a smaller scale. Student’s t test was used to determine that the values are, in fact, statistically different (p < 0.05). C, The percentage of the aforementioned T cell populations that is CD44high. Data are represented as the mean ± SD. Statistical decreases (asterisks) from GFP+ T cells were determined by one-way ANOVA (p < 0.05).

References

    1. Zinkernagel RM, Doherty PC. Restriction of in vitro T cell-mediated cytotoxicity in lymphocytic choriomeningitis within a syngeneic or semiallogeneic system. Nature. 1974;248:701. - PubMed
    1. Stern LJ, Wiley DC. Antigenic peptide binding by class I and class II histocompatibility proteins. Structure. 1994;2:245. - PubMed
    1. Tough DF, Borrow P, Sprent J. Induction of bystander T cell proliferation by viruses and type I interferon in vivo. Science. 1996;272:1947. - PubMed
    1. Gangappa S, Babu JS, Thomas J, Daheshia M, Rouse BT. Virus-induced immunoinflammatory lesions in the absence of viral antigen recognition. J. Immunol. 1998;161:4289. - PubMed
    1. Ehl S, Hombach J, Aichele P, Rulicke T, Odermatt B, Hengartner H, Zinkernagel R, Pircher H. Viral and bacterial infections interfere with peripheral tolerance induction and activate CD8+ T cells to cause immunopathology. J. Exp. Med. 1998;187:763. - PMC - PubMed

Publication types