. 2004 Oct 6;24(40):8796-805.
doi: 10.1523/JNEUROSCI.1940-04.2004.

Developmentally regulated switch in alternatively spliced SNAP-25 isoforms alters facilitation of synaptic transmission

Affiliations

Developmentally regulated switch in alternatively spliced SNAP-25 isoforms alters facilitation of synaptic transmission

Christina Bark et al. J Neurosci. .

Abstract

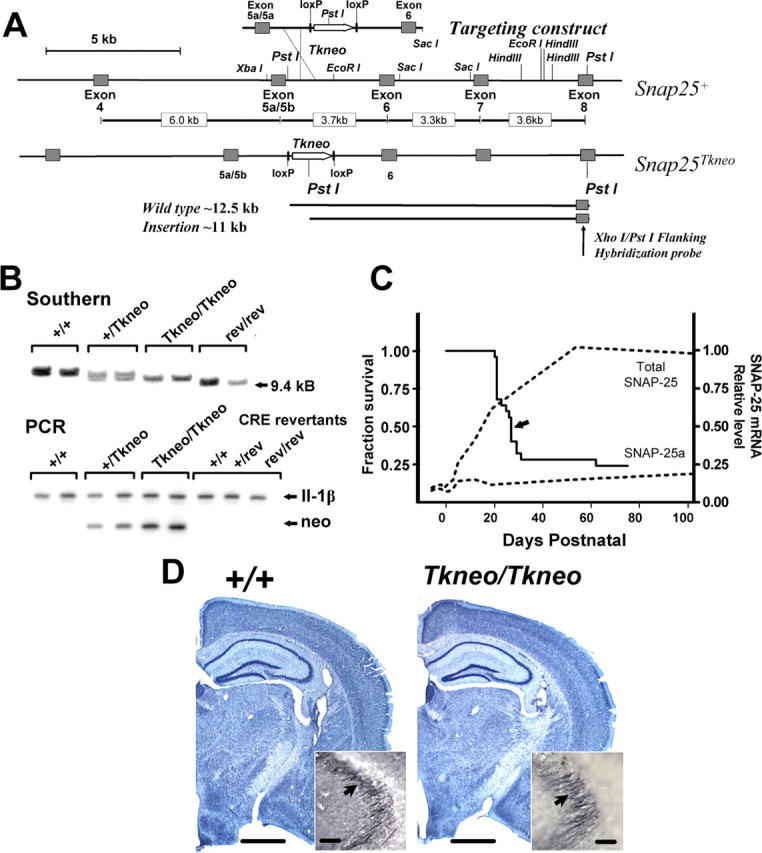
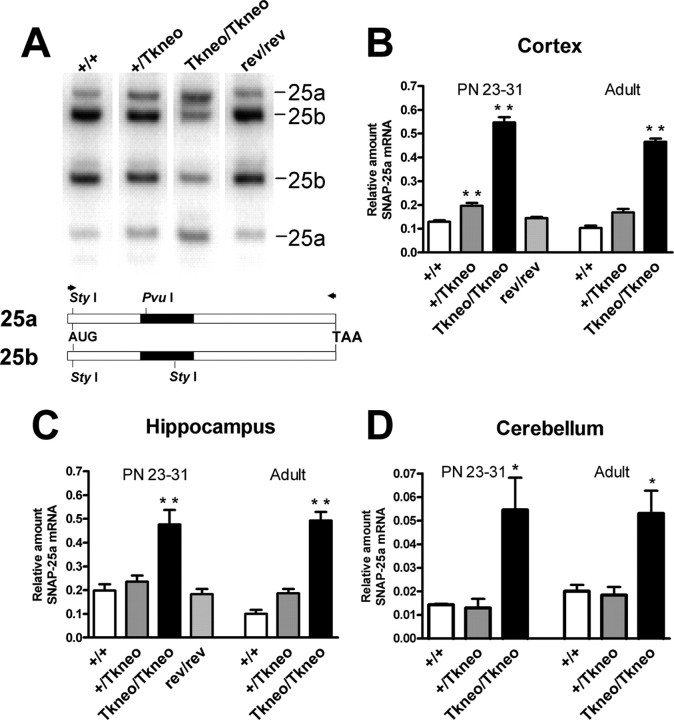
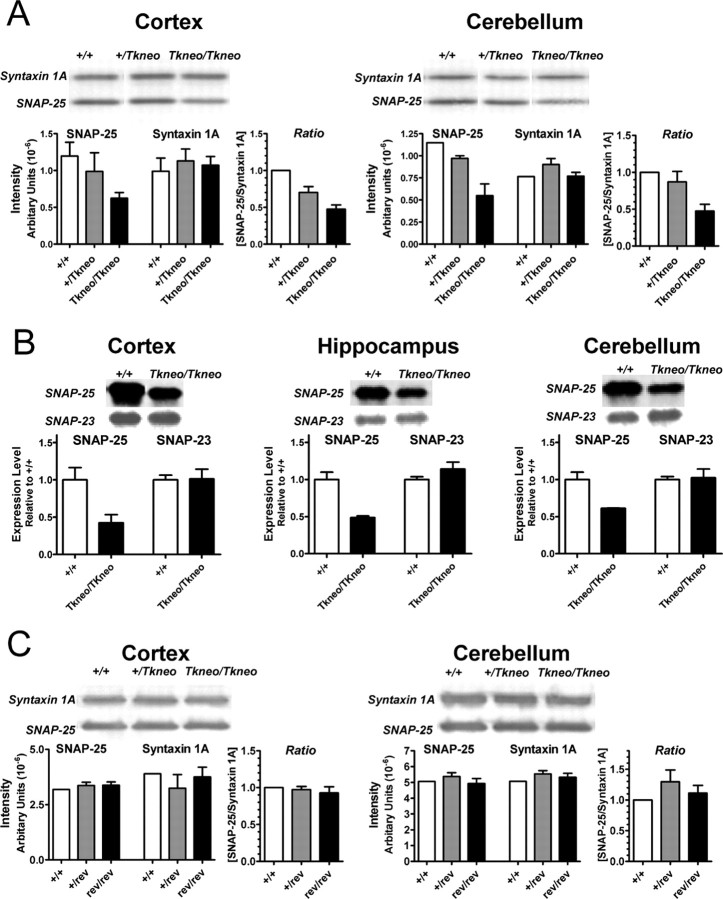
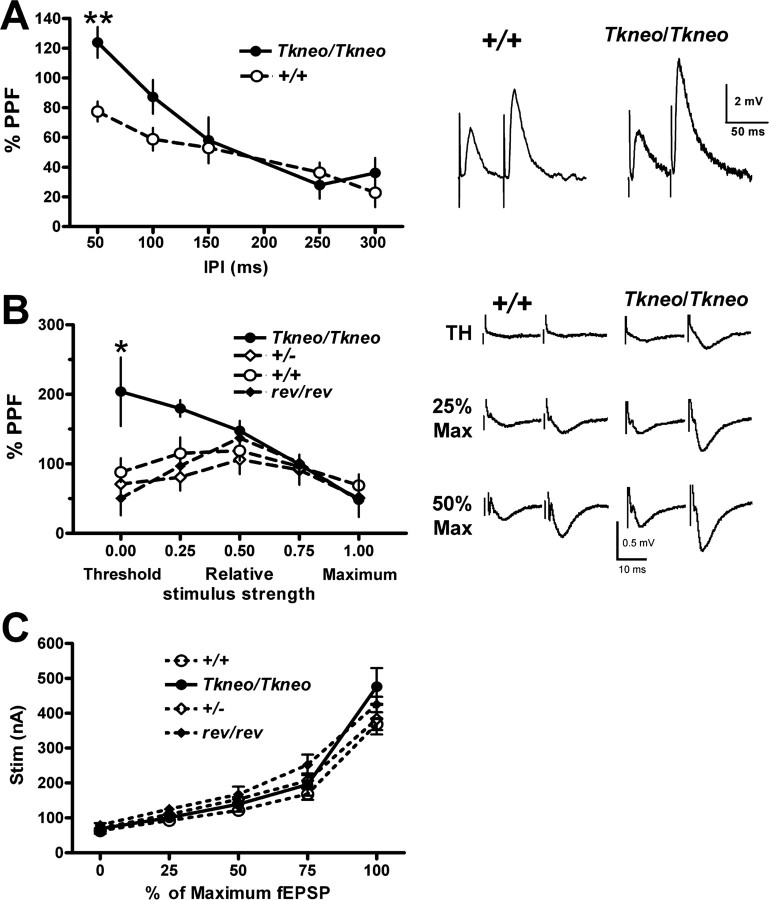
Although the basic molecular components that promote regulated neurotransmitter release are well established, the contribution of these proteins as regulators of the plasticity of neurotransmission and refinement of synaptic connectivity during development is elaborated less fully. For example, during the period of synaptic growth and maturation in brain, the expression of synaptosomal protein 25 kDa (SNAP-25), a neuronal t-SNARE (soluble N-ethylmaleimide-sensitive factor attachment protein receptor) essential for action potential-dependent neuroexocytosis, is altered through alternative splicing of pre-mRNA transcripts. We addressed the role of the two splice-variant isoforms of SNAP-25 with a targeted mouse mutation that impairs the shift from SNAP-25a to SNAP-25b. Most of these mutant mice die between 3 and 5 weeks of age, which coincides with the time when SNAP-25b expression normally reaches mature levels in brain and synapse formation is essentially completed. The altered expression of these SNAP-25 isoforms influences short-term synaptic function by affecting facilitation but not the initial probability of release. This suggests that mechanisms controlling alternative splicing between SNAP-25 isoforms contribute to a molecular switch important for survival that helps to guide the transition from immature to mature synaptic connections, as well as synapse regrowth and remodeling after neural injury.


Figures

Figure 1.
Figure 1.
Targeted insertion of Tkneo selection transgene downstream of exon 5a and 5b in the Snap25 gene results in postnatal lethality. A, Schematic diagram demonstrating the generation and structure of the mutation Snap25Tkneo. The floxed Tkneo selection gene was inserted at the EcoRI site between the tandemly arranged exons 5a and 5b and exon 6 in a targeting construct generated from the wild-type gene (Snap25+) described in Washbourne et al. (2002). In the targeting construct, a PvuI-HindIII fragment containing exon 5a and 5b sequences was exchanged for an exon 5a-5a sequence produced by multiplex PCR (C. Bark, unpublished data). Sequence analysis of genomic PCR products obtained from DNA of homozygous mutant mice demonstrated that exon 5a and 5b in fact were intact in Snap25Tkneo mutant mice (see Material and Methods), indicating that the 5′ site of homologous recombination was downstream of exon 5. The bottom of the panel depicts the 3′ flanking XhoI-PstI fragment used to screen ES cell and genomic DNAs for homologous recombination by Southern blotting and the expected PstI fragments detected from wild-type (∼12.5 kb) and the targeted mutant (∼11 kb) alleles. A more representative diagram of the genomic structure of the Snap25 gene locus with the lengths of the respective intron sequences is shown between the maps of the endogenous Snap25+ and mutant Snap25Tkneo alleles. B, Representative genotyping by Southern blot of PstI restriction fragment length and by a genomic PCR assay that compares products of semiquantitative amplification of the inserted TKneo gene (neo) and of IL-1β, a flanking control gene on mouse chromosome 2. C, Survival curve demonstrating the postnatal lethality of homozygous Snap25Tkneo mutants (n = 25). Seven of 25 mice died before weaning, which is represented by the sharp drop at P21, and 6 of 25 survived >75 d; the median age of survival of P27 is indicated by an arrow. No remarkable postnatal lethality was observed for heterozygote or revertant mice, and their survival appears comparable with wild type. For comparison, the expression profiles of SNAP-25a and total SNAP-25 mRNAs, modified from Bark et al. (1995), are shown (dotted lines). D, Nissl staining reveals grossly normal morphology of mutant adult (PN78) brains (right, Tkneo/Tkneo) compared with wild-type (left, +/+) littermates; note the well structured development of the hippocampal formation in the mutant. Inset, Immunohistochemical staining for SNAP-25 of mossy fiber presynaptic terminals adjacent to the CA3 region of hippocampus (arrows) shows the characteristic accumulation of SNAP-25 in mutant mice, comparable with wild type. Scale bars: D, 1 mm; inset in D, 50 μm.
Figure 2.
Figure 2.
Increased levels of SNAP-25a mRNA are expressed in Snap25Tkneo mutant mice. A, Representative RT-PCR assay for SNAP-25 isoform mRNAs isolated from cortex of wild-type (+/+), heterozygote (+/Tkneo), homozygote mutant (Tkneo/Tkneo) and Cre-revertant (rev/rev) mice. PvuI and StyI restriction fragments that correspond to the 25a and 25b isoforms are indicated on the right. Below, a diagram depicts the open reading frame of the isoform mRNAs with the relative positions of PvuI and StyI sites within exon 5 (filled) that are diagnostic for spliced exon 5a or 5b; AUG and TAA indicate translational start and stop codons, respectively. Arrowheads indicate the position of the primers for RT-PCR. B-D, Quantification of SNAP-25a mRNA expression, relative to total SNAP-25 mRNA, in cortex, hippocampus, and cerebellum in wild-type, mutant, and revertant control mice. Data are expressed as the mean (±SEM) relative proportion of SNAP-25a mRNA in the total cleaved PCR product from preparations of individual mice at the ages shown (n = 3-11). Significantly increased SNAP-25a mRNA expression was seen in cortex and hippocampus of weaned (PN24-30) and adult (PN > 100) homozygous mutants (**p < 0.001; *p < 0.05; one-way ANOVA), but not in PN24-30 revertant mice, whereas in cerebellum an increased level of SNAP-25a mRNA was detected transiently in PN24-31 but not in PN35-45 mutant mice. Note that SNAP-25a mRNA expression in general is considerably lower in cerebellum, but particularly in weanlings (both in wild type and in mutants) compared with cortex and hippocampus, which may reflect either postnatal development or synaptic plasticity of this brain region.
Figure 3.
Figure 3.
Decreased levels of SNAP-25 protein in the Snap25Tkneo mutants but not Cre-revertant mice. Western blots of total protein isolated from indicated brain regions of 24- to 40-d-old mice of the Tkneo mutants and Cre revertants were probed for SNAP-25 [monoclonal antibody (mAb) SMI 81] and syntaxin 1A (mAb HPC-1) (A, C), and SNAP-25 (mAb SMI 81) and SNAP-23 [polyclonal antibody (pAb) PA1-783] (B). A, Semiquantitative Western blot analysis of 31- to 37-d-old Tkneo mutants shows ∼50% reduction of SNAP-25 protein in mutant cortex and cerebellum, but no similar decrease of syntaxin 1A expression in these brain regions. The ratios of the intensity of SNAP-25 and syntaxin 1A for each genotype were normalized to the mean value obtained for wild type (+/+). B, In 24-d-old Tkneo mutants, SNAP-25 also showed a ∼50% reduction in cortex, hippocampus, and cerebellum without a comparable alteration in SNAP-23 levels. Data are represented as the relative levels of SNAP-23 and SNAP-25 for each genotype normalized to the mean values obtained for wild type (+/+). C, SNAP-25 protein levels were not reduced in cortex or cerebellum of 35- to 40-d-old Cre-revertant mice. The relative levels of SNAP-25 compared with syntaxin in the revertants were calculated as in A. Representative images of the immunoreactive protein bands are shown above the histograms derived by PhosphorImager quantification of band intensities. Where indicated, the data represent the mean ± SEM obtained from duplicate or triplicate determinations.
Figure 4.
Figure 4.
Presynaptic short-term plasticity at CA1 hippocampal synapses is enhanced in SNAP-25a-overexpressing mutants. A, PPF assayed by intracellular microelectrode recordings. %PPF = 100 * (EPSP2 - EPSP1)/EPSP1 determined from EPSPs in response to approximately half-maximum stimulation of Schaffer collateral at IPIs between 50 and 300 msec. **Significant difference in facilitation at 50 msec between mutant and wild type (p < 0.01; unpaired t test). Representative traces are presented on the right. B, PPF was measured with extracellular field recordings of paired stimuli 50 msec apart at stimulus strengths determined to give threshold: 25, 50, 75, or 100% maximum field responses as indicated. Two-way ANOVA showed significant effect of interaction between genotype and relative stimulus strength (F(12,90) = 2.05; p < 0.05). Post hoc tests showed significantly increased facilitation in Snap25Tkneo/Tkneo animals compared with wild-type, heterozygote null, and revertant controls at threshold (**p > 0.01) and from heterozygote and revertant controls at 0.25 maximal stimulus (*p < 0.5). Note that increased facilitation was observed using both intracellular and extracellular recording methods, varying stimulus interval or stimulus response, respectively. C, Input-output curve calculated from extracellular recordings shown in B. A Two-way ANOVA with repeated measures showed significant interaction between genotype and %fEPSP (F(12,72) = 2.358; p = 0.0128) but no effect of genotype (F(3,72) = 1.654; p > 0.2) or difference between genotypes at any value for %fEPSP (Bonferroni post-tests; p > 0.5), indicating no substantial difference between mutant and control synaptic responses under these conditions. Representative traces of extracellular paired-pulse recordings from wild-type (+/+) and Snap25Tkneo/Tkneo mutants (Tkneo/Tkneo) at threshold (TH), 25 and 50% of maximal EPSC response used to generate the PPF and input-output curves are shown on the right. Error bars represent SEM.
Figure 5.
Figure 5.
Enhanced short-term facilitation is not caused by increased probability of release. The time course of MK-801 block of NMDAR EPSCs in response to Schaffer collateral stimulation was used to measure basal probability of glutamate release. No difference was seen between genotypes in the time course of the EPSC decay, and a one-way ANOVA showed no significant effects on the averaged individual decay curves (left inset, τ) between genotypes (Tkneo/Tkneo, 73.2 ± 8.3 sec, n = 9; heterozygote +/-, 68.6 ± 13.8 sec, n = 6; wild type +/+ (74.2 ± 7.6 sec, n = 7; F(2,20) = 0.2276; p > 0.5). Representative traces of NMDA currents recorded before MK-801 application are shown in the right insets. Error bars indicate SEM.
None
None
None

References

    1. Bark IC (1993) Structure of the chicken gene for SNAP-25 reveals duplicated exon encoding distinct isoforms of the protein. J Mol Biol 233: 67-76. - PubMed
    1. Bark IC, Wilson MC (1994) Human cDNA clones encoding two different isoforms of the nerve terminal protein SNAP-25. Gene 139: 291-292. - PubMed
    1. Bark IC, Hahn KM, Ryabinin AE, Wilson MC (1995) Differential expression of SNAP-25 protein isoforms during divergent vesicle fusion events of neural development. Proc Natl Acad Sci USA 92: 1510-1514. - PMC - PubMed
    1. Bock JB, Matern HT, Peden AA, Scheller RH (2001) A genomic perspective on membrane compartment organization. Nature 409: 839-841. - PubMed
    1. Boschert U, O'Shaughnessy C, Dickinson R, Tessari M, Bendotti C, Catsicas S, Pich EM (1996) Developmental and plasticity-related differential expression of two SNAP-25 isoforms in the rat brain. J Comp Neurol 367: 177-193. - PubMed

Publication types

MeSH terms

LinkOut - more resources