. 2004 Oct 27;23(21):4330-41.
doi: 10.1038/sj.emboj.7600434. Epub 2004 Oct 7.

Macrodomain organization of the Escherichia coli chromosome

Affiliations

Macrodomain organization of the Escherichia coli chromosome

Michèle Valens et al. EMBO J. .

Abstract

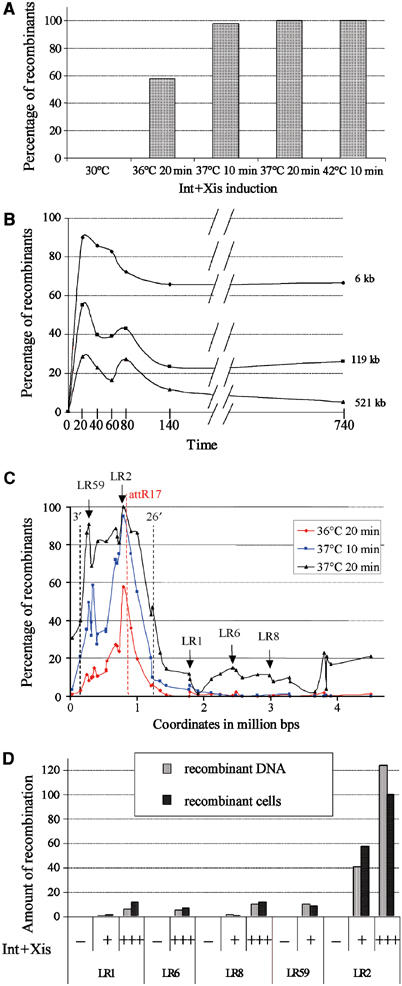
We have explored the Escherichia coli chromosome architecture by genetic dissection, using a site-specific recombination system that reveals the spatial proximity of distant DNA sites and records interactions. By analysing the percentages of recombination between pairs of sites scattered over the chromosome, we observed that DNA interactions were restricted to within subregions of the chromosome. The results indicated an organization into a ring composed of four macrodomains and two less-structured regions. Two of the macrodomains defined by recombination efficiency are similar to the Ter and Ori macrodomains observed by FISH. Two newly characterized macrodomains flank the Ter macrodomain and two less-structured regions flank the Ori macrodomain. Also the interactions between sister chromatids are rare, suggesting that chromosome segregation quickly follows replication. These results reveal structural features that may be important for chromosome dynamics during the cell cycle.


Figures

Figure 1
Figure 1
Versatility of the site-specific recombination system of phage lambda and recombination scenarios between att sites located on the E. coli chromosome. (A) Integrative and excisive recombination promoted by ‘Int' and ‘Int+Xis'. In the presence of Int, recombination between attB and attP sites generates attL and attR sites. In the absence of Xis, the inverted configuration is blocked and restoration of the initial state will be possible only in the presence of Int and Xis. (B) attP and attB cassettes allowing phenotypic detection of recombined fragments. A 27-bp fragment corresponding to λ attB has been inserted in-frame in the lacZ coding region. Integrative recombination disrupts lacZ integrity. A reciprocal transaction between attL and attR cassettes restores lacZ integrity. (C) Recombination between directly repeated att sites. Recombination between directly repeated attL and attR sites located on the same chromosome results in a deletion of the intervening fragment A (1, excisive deletion). Recombination between attL and attR sites located on different chromatids provokes duplication of the intervening fragment A on one of the two chromatids and deletion of the same fragment on the other chromatid (2). Identity of the att site between the duplicated fragments (attB or attP, attB in the example shown) varies with the position of attL relative to that of attR. (D) Recombination between inverted attL and attR sites located on the same chromosome results in inversion of the intervening fragment A (1, excisive inversion). Recombination between attL and attR sites located on different chromatids provokes the formation of a palindromic chromosome dimer presumably lethal (2) (Nash, 1996).
Figure 2
Figure 2
Long-distance DNA interactions revealed by excisive recombination. (A) Excisive recombination of 6-kb fragment (strain LR2) promoted by different amounts of recombinase. Int+Xis induction was performed for different times at different temperatures. The x-axis indicates conditions providing the amount of Int+Xis synthesized. (B) Kinetics of excisive inversions of 6 kb (LR2, indicated by diamonds), 119 kb (LR19, indicated by squares) and 521 kb (LR59, represented by triangles) fragments. Culture samples were plated 20, 40, 60, 80, 140 and 740 min after the beginning of the Int+Xis induction (20 min at 36°C as deduced from (A)). The high level of recombinants in the early time points resulted from the high efficiency of excisive recombination and the incomplete segregation of the recombined chromosomes. The segregation of recombinant chromosomes was achieved after 120 min since the number of recombinant clones became stable after that time and the colonies became uniform. (C) Long-range DNA interactions are restricted to subregions of the chromosome. Percentage of recombinants obtained between attR17 and variously inserted attL sites with three different Int+Xis amounts (red line, 20 min of induction at 36°C; blue line, 10 min of induction at 37°C, black line, 20 min of induction at 37°C). The x-axis indicates the nt coordinates of the chromosome and attR17 is indicated by a vertical dashed red line. The 3′ and 26′ regions are indicated. Positions of attL sites from strains used in (D) are indicated. (D) The percentage of recombinants is similar to the amount of recombination detected by qPCR: the percentage of recombinants (dark grey) is reported beside the percentage of recombinant DNA (light grey). The amount of recombination between attL and attR was estimated by qPCR in strains LR1, LR6, LR8, LR59 and LR2 (indicated in (C)) with different amounts of Int+Xis (20 min induction at 36°C (+), 20 min induction at 37°C (+++)). The value greater than 100% for the amount of recombined lacZ DNA in the sample LR2 in (+++) condition of recombinase was obtained because it is calculated upon normalization with the control aadA.
Figure 3
Figure 3
Chromosomal organization features limit long-range DNA interactions. (A) Percentage of recombinants obtained by excisive inversion in two sets of strains carrying one fixed att site (attR17: black; attR22: red) and variously inserted partner att sites with two different Int+Xis amounts (continuous line, 20 min induction at 36°C; dashed line, 10 min of induction at 37°C). The x-axis indicates the nt coordinates of the chromosome. The arrows above the profile indicate the position of the fixed att site (attR17: black; attR22: red). The 3′ and 26′ regions are indicated. (B) Percentage of recombinants obtained by excisive inversion in three sets of strains carrying one fixed att site (attR17: black; attR22: red; attL29: blue) and variously inserted partner att sites with two different Int+Xis amounts (continuous line, 20 min of induction at 36°C; dashed line, 10 min of induction at 37°C). The arrows above the profile indicate the position of the fixed att site (attR17: black; attR22: red; attL29: blue). The 3′, 26′ and 47′ regions are indicated. (C) Graphical representation of the extent of regions competent for recombination deduced from the inversion profiles obtained in (A, B). The circle represents the genetic map of the chromosome. The coloured bars indicate the competent regions from each fixed att site, the position of which is indicated.
Figure 4
Figure 4
Genetic characterization of a macrodomain. (A) Percentage of recombinants obtained by excisive inversion in two sets of strains carrying one fixed att site (attR17: blue; attL7: red) and variously inserted partner att sites. The x-axis indicates the nt coordinates of the chromosome. The arrows above the profile indicate the position of the fixed att site (attL7: red; attR17: blue). The 3′, 26′ and 81′ regions are indicated. (B) Graphical representation of the extent of regions competent for recombination deduced from the inversion profiles obtained in (A). (C) Graphical representation of long-range interactions between various attR and attL sites. The extent of the arc indicates the range of interactions. (D) Graphical representation of the Right macrodomain and the less-structured region. Coloured bars represent the different regions (red: Right macrodomain; blue: less-structured region). Coloured interrupted bars schematize the extent of inversion competent zones from sites located in the respective coloured intervals.
Figure 5
Figure 5
Genetic characterization of macrodomains. (A) Percentage of recombinants obtained by excisive inversion in different sets of strains carrying one fixed att site and variously inserted partner att sites. The x-axis indicates the nt coordinates of the chromosome. The position of the fixed att site is indicated on the right of the panels and by the arrow above the profile. Dashed vertical lines indicate the delimitation of macrodomains and other regions indicated above the profile attL7 and shown in (B). Beside each profile is indicated a graphical representation of the profile on the genetic map. (B) Graphical representation of E. coli macrodomains and less-structured regions. The circle represents the genetic map of the chromosome. Coloured bars represent the different macrodomains and interrupted black bars schematize two less-structured regions. Replication origin oriC, migS and dif sites are indicated.
Figure 6
Figure 6
A model for chromosome organization in E. coli. (A) The chromosome is organized as a ring composed of four macrodomains (Ori, Ter, Right and Left) and two less-structured regions (NS) with flexibility limited to the flanking macrodomains. (B) Two models for the spatial sequestration of macrodomains. On the top, organizing factors bind to DNA separating different regions and defining the different macrodomains. On the bottom, binding of a number of determinants by unidentified factors concentrates DNA regions containing these sites and defines macrodomains. The second model is favoured (see text).

References

    1. Akerlund T, Nordstrom K, Bernander R (1995) Analysis of cell size and DNA content in exponentially growing and stationary-phase batch cultures of Escherichia coli. J Bacteriol 177: 6791–6797 - PMC - PubMed
    1. Azaro MA, Landy A (2002) Integrase and the Int family. In Mobile DNA II, Craig NL, Craigie R, Gellert M, Lambowitz AM (eds) pp 118–148. Washington, DC: ASM Press
    1. Ben-Yehuda S, Rudner DZ, Losick R (2003) RacA, a bacterial protein that anchors chromosomes to the cell poles. Science 299: 532–536 - PubMed
    1. Breier AM, Cozzarelli NR (2004) Linear ordering and dynamic segregation of the bacterial chromosome. Proc Natl Acad Sci USA 101: 9175–9176 - PMC - PubMed
    1. Capiaux H, Cornet F, Corre J, Guijo MI, Perals K, Rebollo JE, Louarn JM (2001) Polarization of the Escherichia coli chromosome. A view from the terminus. Biochimie 83: 161–170 - PubMed

Publication types

MeSH terms