. 2004 Oct 27;23(21):4307-18.
doi: 10.1038/sj.emboj.7600426. Epub 2004 Oct 7.

Inefficient degradation of truncated polyglutamine proteins by the proteasome

Affiliations

Inefficient degradation of truncated polyglutamine proteins by the proteasome

Carina I Holmberg et al. EMBO J. .

Abstract

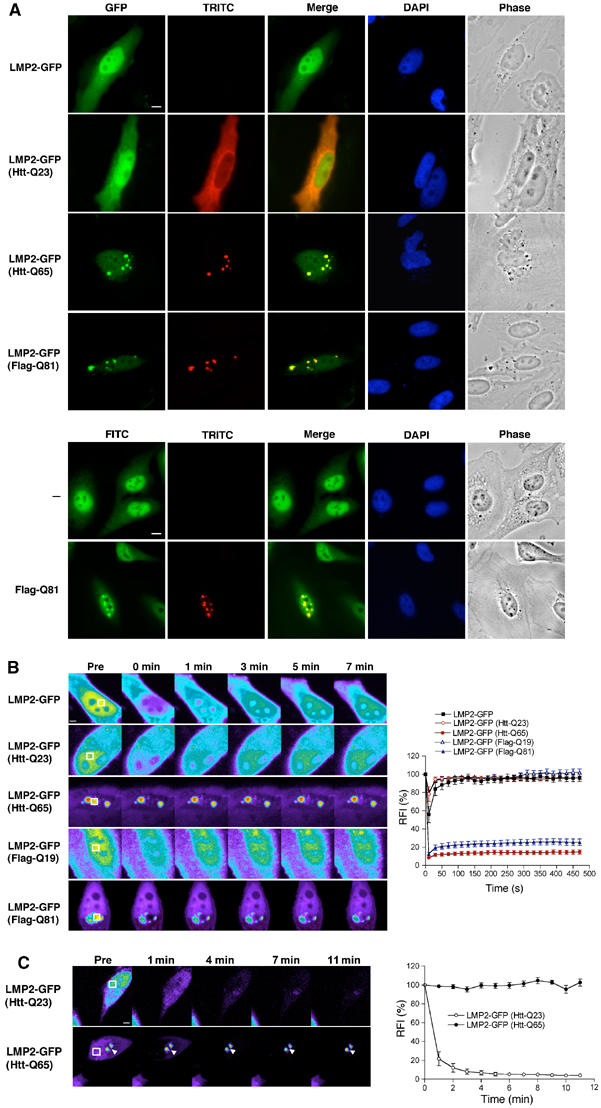
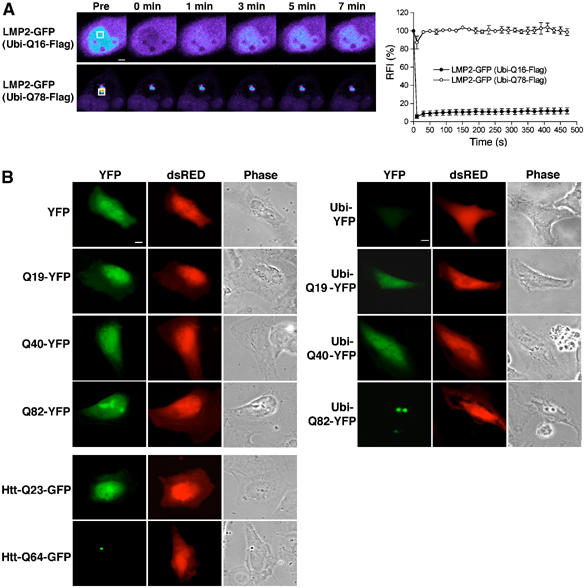
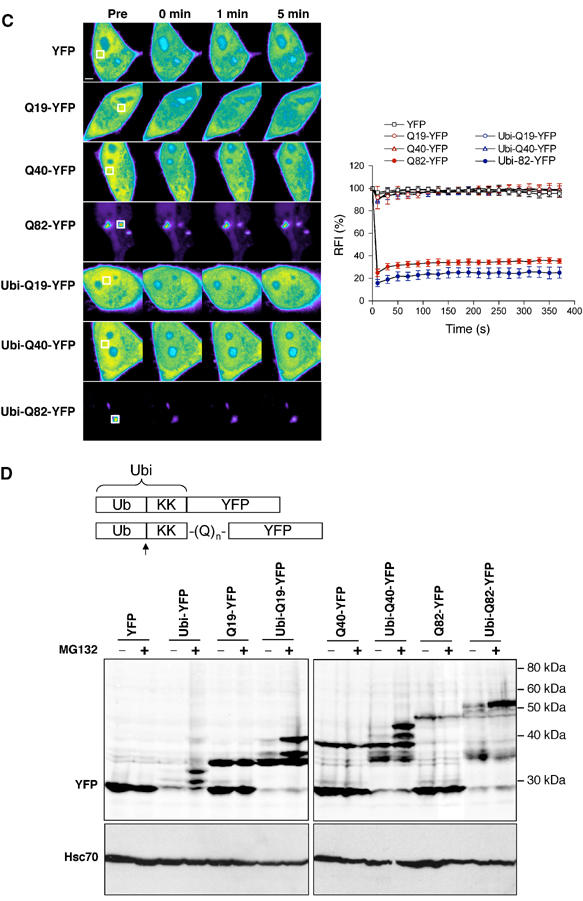
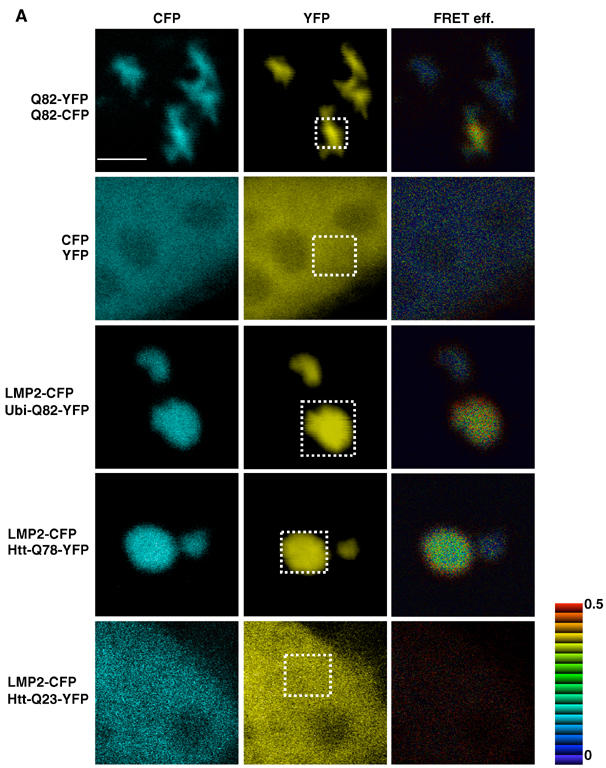
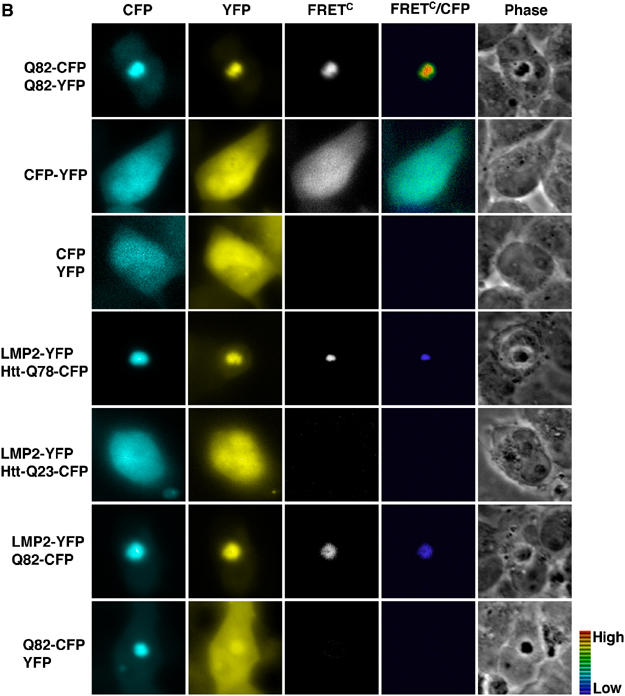
Accumulation of mutant proteins into misfolded species and aggregates is characteristic for diverse neurodegenerative diseases including the polyglutamine diseases. While several studies have suggested that polyglutamine protein aggregates impair the ubiquitin-proteasome system, the molecular mechanisms underlying the interaction between polyglutamine proteins and the proteasome have remained elusive. In this study, we use fluorescence live-cell imaging to demonstrate that the proteasome is sequestered irreversibly within aggregates of overexpressed N-terminal mutant Huntingtin fragment or simple polyglutamine expansion proteins. Moreover, by direct targeting of polyglutamine proteins for proteasomal degradation, we observe incomplete degradation of these substrates both in vitro and in vivo. Thus, our data reveal that intrinsic properties of the polyglutamine proteins prevent their efficient degradation and clearance. Additionally, fluorescence resonance energy transfer is detected between the proteasome and aggregated polyglutamine proteins indicative of a close and stable interaction. We propose that polyglutamine-containing proteins are kinetically trapped within proteasomes, which could explain their deleterious effects on cellular function over time.


Figures

Figure 1
Figure 1
The proteasome is stably associated with aggregates of mutant Huntingtin and simple polyglutamine expansion proteins. (A) Colocalization of the proteasome with Htt-Q65 or Flag-Q81 aggregates. (Upper panel) HeLa cells were transfected with constructs encoding LMP2-GFP together with Htt-Q23, Htt-Q65, or Flag-Q81 as indicated. The Htt proteins and Flag-Q81 were detected with the HP-1 antibody and an antibody against the Flag epitope, respectively, followed by a TRITC-conjugated secondary antibody. Cells expressing LMP2-GFP (GFP, green) and Htt proteins or Flag-Q81 (TRITC, red) were visualized by fluorescence microscopy and phase contrast microscopy (Phase). Colocalization was illustrated by merging GFP and TRITC images (Merge). DNA was stained with DAPI (DAPI). (Lower panel) Localization of endogenous proteasome in the absence or presence of Flag-Q81 expression was detected using an anti-20S proteasome antibody followed by an FITC-conjugated secondary antibody (FITC, green). Scale bar represents 10 μm. (B) FRAP analysis of LMP2-GFP. Cells were imaged before photobleaching (Pre) of the defined area (white box) and at the indicated times after photobleaching. Note that the intensity of the images is scaled differently between the samples. Scale bar represents 5 μm. Quantitative FRAP analysis of soluble or aggregate-associated LMP2-GFP is shown in the graph in the right panel. The relative fluorescence intensity (RFI) was determined for each time point and is represented as the average±s.e.m. of 5–8 cells. (C) FLIP analysis of LMP2-GFP. Single scan images were obtained before (Pre) and at the indicated times between consecutive bleach pulses of the boxed area (white box). Scale bar represents 5 μm. The RFI was determined for each time point and is represented as the average±s.e.m. of five cells (right panel).
Figure 2a
Figure 2a
Degradation-tagged simple polyglutamine proteins are detected in vivo. (A) FRAP analysis of LMP2-GFP coexpressed with Ubi-Flag-Q16 or Ubi-Flag-Q78. Cells were imaged before photobleaching (Pre) of the defined area (white box) and at the indicated times after photobleaching. Scale bar represents 5 μm. Quantitative FRAP analysis of soluble or aggregate-associated LMP2-GFP is shown in the graph in the right panel. RFI was determined for each time point and is represented as the average±s.e.m. of four cells. (B) Localization of untagged or degradation-tagged simple polyglutamine-YFP proteins. HeLa cells were transfected with constructs encoding YFP, Q19-YFP, Q40-YFP, Q82-YFP, their degradation-tagged counterparts (Ubi-), Htt-Q23-GFP, and Htt-Q64-GFP, as indicated. Coexpression of dsRED protein was used to identify transfected cells. Cells expressing YFP fusion proteins (YFP, pseudo-colored in green) and dsRED were visualized by fluorescence microscopy and phase contrast microscopy (Phase). Scale bar represents 10 μm.
Figure 2b
Figure 2b
(C) FRAP analysis of untagged and degradation-tagged polyglutamine-YFP proteins. Cells were imaged before photobleaching (Pre) of the defined area (white box) and at the indicated times after photobleaching. Scale bar represents 5 μm. Quantitative FRAP analysis of the respective polyglutamine-YFP proteins is shown in the graph. The RFI was determined for each time point and is represented as the average±s.e.m. of 3–5 cells. (D) Schematic representation of the degradation-tagged YFP fusion proteins. The Ubi consists of a ubiquitin molecule (Ub) followed by a 40-amino-acid lysine-containing linker region. Ubiquitin cleavage is indicated by an arrow. (Upper panel) Western blot analysis of HeLa cells expressing untagged or degradation-tagged YFP fusion proteins in the absence or presence of MG132 (10 μM). (Lower panel) Hsc70 was used as a loading control.
Figure 3
Figure 3
Polyglutamine-YFP proteins are incompletely degraded by the proteasome in vitro. Proteasome degradation of 35S-labeled Ubi-(Q)n-YFP proteins in reticulocyte lysate. (Left panel) The T lane in the autoradiograms contains the untreated Ubi-tagged YFP fusion proteins (indicated by arrowheads). Upon preincubation of substrate protein in ATP-depleted reticulocyte lysate, the N-terminal ubiquitin moiety has been removed (arrows). Degradation was initiated by addition of ATP and aliquots were collected at the indicated time points. Quantification of the autoradiograms is shown in the upper right panel. The amount of remaining substrate proteins, including their ubiquitinated forms (circle), and the degradation end product (squares) is plotted as the mean±s.e.m. of 3–4 independent experiments. The lower right panel shows an autoradiogram of Ubi-YFP after 30 min of degradation and the degradation end products of Ubi-(Q)n-YFP after 150 min.
Figure 4a
Figure 4a
FRET occurs between proteasome and polyglutamine proteins in the aggregates. (A) Acceptor photobleaching experiments were performed using LMP2-CFP as the donor and YFP fused to Ubi-Q82, Htt-Q78, or Htt-Q23 as the acceptor fluorophores. Cells coexpressing aggregated Q82-CFP/Q82-YFP or soluble CFP and YFP were used as positive and negative controls, respectively. Each panel consists of the CFP, YFP, and the FRET efficiency image (FRET eff.) of transiently transfected HeLa cells. The YFP and CFP images were taken before photobleaching of the YFP fusion proteins in the defined area (white box). The FRET efficiency is indicated by the pseudo-color scale next to FRET efficiency image. Scale bar represent 5 μm.
Figure 4b
Figure 4b
(B) To measure the emission of the acceptor by donor excitation, experiments were performed using LMP2-YFP as the acceptor fluorophore and Htt-Q78-CFP, Htt-Q23-CFP, and Q82-CFP as the donor fluorophores. Cells expressing aggregated Q82-CFP/Q82-YFP or a CFP-YFP chimera were used as positive controls, while cells expressing CFP and YFP were used as a negative control. Each panel consists of CFP, YFP, corrected FRET (FRETC), FRETC/CFP ratio, and phase images. The pseudo-color scale indicates the FRETC/CFP ratio, ranging from 0 to 2, in which violet color indicates low FRET and red indicates high FRET. No FRET is indicated by black.

Similar articles

Cited by

References

    1. Bence NF, Sampat RM, Kopito RR (2001) Impairment of the ubiquitin–proteasome system by protein aggregation. Science 292: 1552–1555 - PubMed
    1. Berney C, Danuser G (2003) FRET or no FRET: a quantitative comparison. Biophys J 84: 3992–4010 - PMC - PubMed
    1. Chai Y, Shao J, Miller VM, Williams A, Paulson HL (2002) Live-cell imaging reveals divergent intracellular dynamics of polyglutamine disease proteins and supports a sequestration model of pathogenesis. Proc Natl Acad Sci USA 99: 9310–9315 - PMC - PubMed
    1. Chen D, Huang S (2001) Nucleolar components involved in ribosome biogenesis cycle between the nucleolus and nucleoplasm in interphase cells. J Cell Biol 153: 169–176 - PMC - PubMed
    1. Chen HK, Fernandez-Funez P, Acevedo SF, Lam YC, Kaytor MD, Fernandez MH, Aitken A, Skoulakis EM, Orr HT, Botas J, Zoghbi HY (2003) Interaction of Akt-phosphorylated ataxin-1 with 14-3-3 mediates neurodegeneration in spinocerebellar ataxia type 1. Cell 113: 457–468 - PubMed

Publication types

MeSH terms