Restoration of the cystic fibrosis transmembrane conductance regulator function by splicing modulation
- PMID: 15472711
- PMCID: PMC1299168
- DOI: 10.1038/sj.embor.7400273
Restoration of the cystic fibrosis transmembrane conductance regulator function by splicing modulation
Abstract
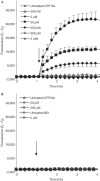
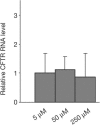
A significant fraction of disease-causing mutations affects pre-mRNA splicing. These mutations can generate both aberrant and correct transcripts, the level of which varies among different patients. An inverse correlation was found between this level and disease severity, suggesting a role for splicing regulation as a genetic modifier. Overexpression of splicing factors increased the level of correctly spliced RNA, transcribed from minigenes carrying disease-causing splicing mutations. However, whether this increase could restore the protein function was unknown. Here, we demonstrate that overexpression of Htra2-beta1 and SC35 increases the level of normal cystic fibrosis transmembrane conductance regulator (CFTR) transcripts in cystic-fibrosis-derived epithelial cells carrying the 3849+10 kb C --> T splicing mutation. This led to activation of the CFTR channel and restoration of its function. Restoration was also obtained by sodium butyrate, a histone deacetylase inhibitor, known to upregulate the expression of splicing factors. These results highlight the therapeutic potential of splicing modulation for genetic diseases caused by splicing mutations.
Figures


Similar articles
-
Splicing modulation as a modifier of the CFTR function.Prog Mol Subcell Biol. 2006;44:233-54. doi: 10.1007/978-3-540-34449-0_10. Prog Mol Subcell Biol. 2006. PMID: 17076271
-
Cellular and viral splicing factors can modify the splicing pattern of CFTR transcripts carrying splicing mutations.Hum Mol Genet. 2000 Jul 22;9(12):1771-8. doi: 10.1093/hmg/9.12.1771. Hum Mol Genet. 2000. PMID: 10915765
-
Variable levels of normal RNA in different fetal organs carrying a cystic fibrosis transmembrane conductance regulator splicing mutation.Am J Respir Crit Care Med. 1999 Jun;159(6):1998-2002. doi: 10.1164/ajrccm.159.6.9808012. Am J Respir Crit Care Med. 1999. PMID: 10351951
-
Pharmacological induction of CFTR function in patients with cystic fibrosis: mutation-specific therapy.Pediatr Pulmonol. 2005 Sep;40(3):183-96. doi: 10.1002/ppul.20200. Pediatr Pulmonol. 2005. PMID: 15880796 Review.
-
The relationship between genotype and phenotype in cystic fibrosis.Curr Opin Pulm Med. 1995 Nov;1(6):450-6. doi: 10.1097/00063198-199511000-00004. Curr Opin Pulm Med. 1995. PMID: 9363081 Review.
Cited by
-
Cystic fibrosis transmembrane regulator protein mutations: 'class' opportunity for novel drug innovation.Paediatr Drugs. 2007;9(1):1-10. doi: 10.2165/00148581-200709010-00001. Paediatr Drugs. 2007. PMID: 17291132 Review.
-
Functional studies on the ATM intronic splicing processing element.Nucleic Acids Res. 2005 Jul 19;33(13):4007-15. doi: 10.1093/nar/gki710. Print 2005. Nucleic Acids Res. 2005. PMID: 16030351 Free PMC article.
-
Splicing mutations in human genetic disorders: examples, detection, and confirmation.J Appl Genet. 2018 Aug;59(3):253-268. doi: 10.1007/s13353-018-0444-7. Epub 2018 Apr 21. J Appl Genet. 2018. PMID: 29680930 Free PMC article. Review.
-
Alternative splicing regulated by butyrate in bovine epithelial cells.PLoS One. 2012;7(6):e39182. doi: 10.1371/journal.pone.0039182. Epub 2012 Jun 14. PLoS One. 2012. PMID: 22720068 Free PMC article.
-
Q1291H-CFTR molecular dynamics simulations and ex vivo theratyping in nasal epithelial models and clinical response to elexacaftor/tezacaftor/ivacaftor in a Q1291H/F508del patient.Front Mol Biosci. 2023 Jun 1;10:1148501. doi: 10.3389/fmolb.2023.1148501. eCollection 2023. Front Mol Biosci. 2023. PMID: 37325471 Free PMC article.
References
-
- Anderson SL, Qiu J, Rubin BY (2003) EGCG corrects aberrant splicing of IKAP mRNA in cells from patients with familial dysautonomia. Biochem Biophys Res Commun 310: 627–633 - PubMed
-
- Andreassi C et al. (2001) Aclarubicin treatment restores SMN levels to cells derived from type I spinal muscular atrophy patients. Hum Mol Genet 10: 2841–2849 - PubMed
-
- Augarten A et al. (1993) Mild cystic fibrosis and normal or borderline sweat test in patients with the 3849+10 kb C → T mutation. Lancet 342: 25–26 - PubMed
-
- Aznarez I, Chan EM, Zielenski J, Blencowe BJ, Tsui LC (2003) Characterization of disease-associated mutations affecting an exonic splicing enhancer and two cryptic splice sites in exon 13 of the cystic fibrosis transmembrane conductance regulator gene. Hum Mol Genet 12: 2031–2040 - PubMed
-
- Bienvenu T et al. (1996) Analysis of alternative splicing patterns in the cystic fibrosis transmembrane conductance regulator gene using mRNA derived from lymphoblastoid cells of cystic fibrosis patients. Eur J Hum Genet 4: 127–134 - PubMed
Publication types
MeSH terms
Substances
LinkOut - more resources
Full Text Sources
Other Literature Sources
Medical

