. 2005 Feb 1;385(Pt 3):787-94.
doi: 10.1042/BJ20040933.

Hepatic farnesyl diphosphate synthase expression is suppressed by polyunsaturated fatty acids

Affiliations

Hepatic farnesyl diphosphate synthase expression is suppressed by polyunsaturated fatty acids

Catherine Le Jossic-Corcos et al. Biochem J. .

Abstract

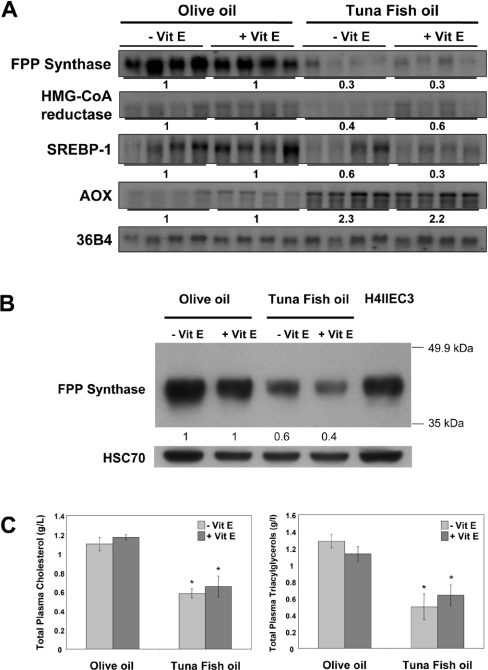
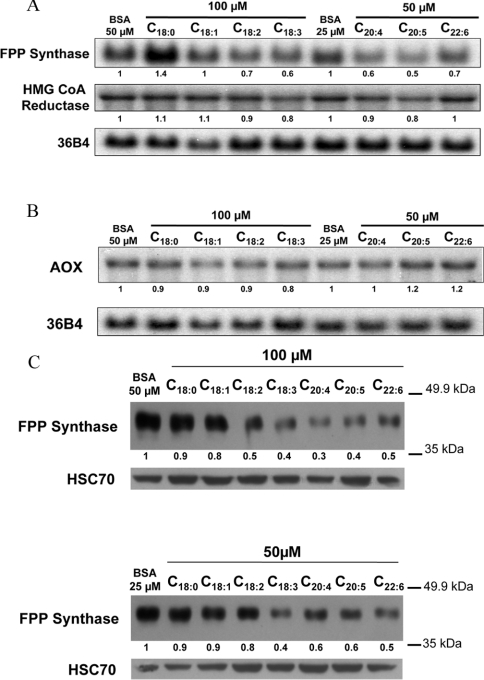
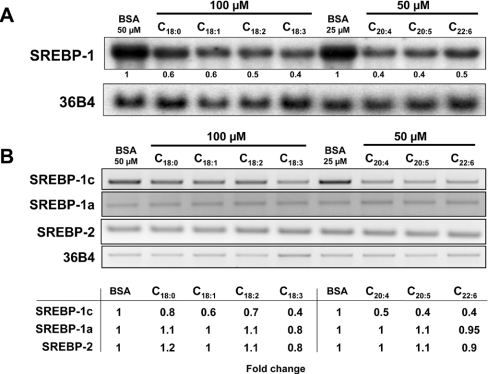
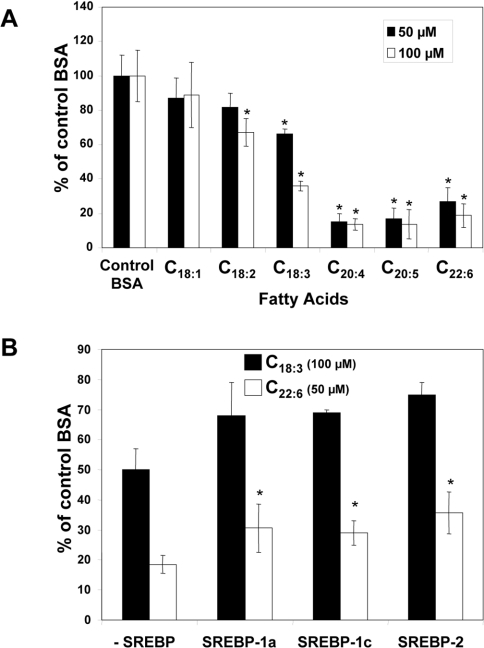
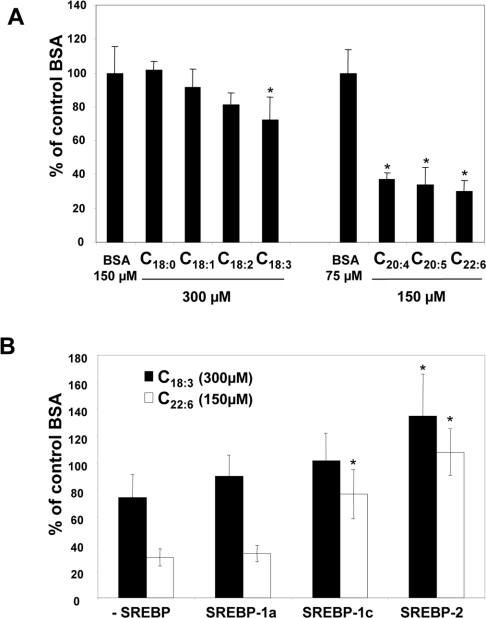
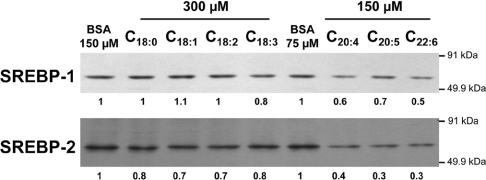
Dietary vegetable oils and fish oils rich in PUFA (polyunsaturated fatty acids) exert hypocholesterolaemic and hypotriglyceridaemic effects in rodents. The plasma cholesterol-lowering properties of PUFA are due partly to a diminution of cholesterol synthesis and of the activity of the rate-limiting enzyme HMG-CoA reductase (3-hydroxy-3-methylglutaryl-CoA reductase). To better understand the mechanisms involved, we examined how tuna fish oil and individual n-3 and n-6 PUFA affect the expression of hepatic FPP synthase (farnesyl diphosphate synthase), a SREBP (sterol regulatory element-binding protein) target enzyme that is subject to negative-feedback regulation by sterols, in co-ordination with HMG-CoA reductase. Feeding mice on a tuna fish oil diet for 2 weeks decreased serum cholesterol and triacylglycerol levels, by 50% and 60% respectively. Hepatic levels of FPP synthase and HMG-CoA reductase mRNAs were also decreased, by 70% and 40% respectively. Individual n-3 and n-6 PUFA lowered FPP synthase and HMG-CoA reductase mRNA levels in H4IIEC3 rat hepatoma cells to a greater extent than did stearate and oleate, with the largest inhibitory effects occurring with arachidonate, EPA (eicosapentaenoic acid) and DHA (docosahexaenoic acid). We observed a similar inhibitory effect on protein levels of FPP synthase. The suppressive effect of PUFA on the FPP synthase mRNA level was not due to a decrease in mRNA stability, but to transcription inhibition. Moreover, a lower nuclear availability of both SREBP-1 and SREBP-2 mature forms was observed in HepG2 human hepatoblastoma cells treated with arachidonate, EPA or DHA. Taken together, these data suggest that PUFA can down-regulate hepatic cholesterol synthesis through inhibition of HMG-CoA reductase and FPP synthase, at least in part through impairment of the SREBP pathway.


Figures

Figure 1
Figure 1. Effects of a PUFA-rich diet on hepatic cholesterogenesis gene expression, FPP synthase protein levels and plasma cholesterol and triacylglycerol levels in mice
(A) Northern blot analysis of FPP synthase, HMG-CoA reductase and SREBP-1 mRNA levels in liver. The AOX mRNA level was analysed as a marker of PPARα activation by PUFA. mRNA levels were normalized to those of 36B4 mRNA. mRNA levels in animals fed on a tuna fish oil-enriched diet (four male mice) relative to olive oil control treatment (determined by densitometry) are indicated. (B) Western blot analysis of FPP synthase protein levels in liver. Samples of 60 μg of total protein pooled from four male mice for each diet group were electrophoresed, and immunoblot analyses were performed with rabbit anti-(rat FPP synthase) IgG. Protein levels were normalized to amounts of HSC70 used as a control. Protein levels from tuna fish oil-fed mice relative to olive oil-fed control mice (determined by densitometry) are indicated. A H4IIEC3 protein sample was used as control of the immunoreactivity of anti-(rat FPP synthase) antibody. (C) Plasma cholesterol and triacylglycerol levels of mice fed on the olive oil or the tuna fish oil diet were assessed in arterial blood. Significance of differences: *P<0.05 compared with olive oil group (Student's t test). Vit E, vitamin E.
Figure 2
Figure 2. Effects of fatty acids on the expression of genes involved in cholesterol synthesis and in peroxisomal fatty acid β-oxidation, and on FPP synthase protein expression, in H4IIEC3 rat hepatoma cells
Northern blot analysis of the expression of FPP synthase, HMG-CoA reductase (A) and AOX (B) after fatty acid treatment for 18 h. mRNA levels were normalized to those of 36B4 mRNA. mRNA levels relative to BSA control treatments (determined by densitometry) are indicated. One Northern blot analysis representative of five independent experiments is shown. (C) Western blot analysis of FPP synthase protein levels after treatment with 50 μM or 100 μM fatty acid for 18 h, normalized to HSC70 protein levels. Protein levels relative to BSA control treatment (determined by densitometry) are indicated (data from one experiment representative of two independent experiments).
Figure 3
Figure 3. Effects of fatty acids on SREBP gene expression in H4IIEC3 rat hepatoma cells
(A) Northern blot analysis of SREBP-1 gene expression in H4IIEC3 cells after fatty acid treatment for 18 h. (B) RT-PCR analysis of SREBP-1a, -1c and -2 mRNA levels after fatty acid treatment for 18 h. mRNA levels relative to BSA control treatments (determined by densitometry) are indicated under each lane in (A) and in the table for (B). The data are representative of three independent experiments.
Figure 4
Figure 4. Transcriptional analysis in H4IIEC3 cells
(A) Cells were transiently transfected with pGL3-FFPS317 plus pCMVβ-gal with Lipofectin® for 4 h. Cells were then incubated for 18 h with BSA alone or with 50 or 100 μM fatty acid. Luciferase and β-galactosidase activities were determined as described in the Materials and methods section. Data are expressed as percentages of values following control BSA treatment, and represent results from at least three experiments performed in triplicate. In the treatments with 50 μM fatty acid, the BSA concentration was 25 μM, while it was 50 μM in the presence of 100 μM fatty acid.*P<0.05, statistically different from control (Student's t test). (B) Cells were transiently transfected with pGL3-FPPS317, pCMVβ-gal and an expression vector for SREBP-1a, -1c or -2 (or empty vector as a control). After transfection, cells were incubated with BSA alone or with 100 μM linolenate (C18:3) or 50 μM DHA (C22:6) for 18 h. Activities were measured as in (A). Data are expressed as percentages of values following control BSA treatment, and represent results from at least three experiments performed in triplicate. *P<0.05, statistically different from control (Student's t test).
Figure 5
Figure 5. Transcriptional analysis in HepG2 cells
(A) Cells were transiently transfected with pGL3-FFPS317 plus pCMVβ-gal with Lipofectin® for 4 h. Cells were then incubated for 18 h with BSA alone or with 150 or 300 μM fatty acid. Luciferase and β-galactosidase activities were determined as described in the Materials and methods section. Data are expressed as percentages of values following control BSA treatment, and are from a representative experiment performed in triplicate. *P<0.05, Statistically different from control (Student's t test). (B) Cells were transiently transfected with pGL3-FPPS317, pCMVβ-gal and an expression vector for SREBP-1a, -1c or -2 (or with an empty vector as control). After transfection, cells were incubated with BSA alone or with 300 μM linolenate (C18:3) or 150 μM DHA (C22:6) for 18 h. Activities were measured as in (A). Data are expressed as percentages of values following control BSA treatment, and represent results from at least three experiments performed in triplicate. *P<0.05, Statistically different from control (Student's t test).
Figure 6
Figure 6. Effects of linolenate and DHA on the turnover of FPP synthase mRNA in H4IIEC3 cells
Cells were treated with DRB (100 μM) in the absence or the presence of 100 μM linolenate (C18:3) or 50 μM DHA (C22:6). Total RNA isolated from cells 0, 4, 8, 12, 16, 20 or 24 h (A) or 0, 4, 8, 14, 18 or 24 h (B) following DRB treatment was analysed by Northern blot with an FPP synthase probe, as described in the Materials and methods section. The FPP synthase mRNA level was standardized to 18 S rRNA levels. The data are from one representative experiment of three independent experiments for linolenate and two independent experiments for DHA. The FPP synthase mRNA decay equations for BSA and linolenate are y=−0.0335x+1.0138 and y=−0.0314x+1.002 respectively. The FPP synthase mRNA decay equations for BSA and DHA are y=−0.0369x+0.8267 and y=−0.0377x+0.8128 respectively.
Figure 7
Figure 7. SREBP immunoblot analysis of nuclear extracts of HepG2 cells
Cells were incubated with control BSA medium or medium containing BSA-bound fatty acids (300 or 150 μM) for 18 h. Aliquots of each sample (25 μg of nuclear protein) were electrophoresed on SDS/10%-polyacrylamide gels and immunoblot analyses were performed with mouse monoclonal antibody IgG 2A4 against amino acids 301–407 of human SREBP-1, or with mouse monoclonal antibody IgG 1C6 against amino acids 833–1141 of human SREBP-2. Protein levels relative to BSA control treatments (determined by densitometry) are indicated under each lane. One representative Western blot from two independent experiments is shown.

References

    1. Ross R. The pathogenesis of atherosclerosis: a perspective for the 1990s. Nature (London) 1993;362:801–809. - PubMed
    1. Hooper L., Summerbell C. D., Higgins J. P., Thompson R. L., Capps N. E., Smith G. D., Riemersma R. A., Ebrahim S. Dietary fat intake and prevention of cardiovascular disease: systematic review. Br. Med. J. 2001;322:757–763. - PMC - PubMed
    1. Angerer P., von Schacky C. n-3 polyunsaturated fatty acids and the cardiovascular system. Curr. Opin. Lipidol. 2000;1:57–63. - PubMed
    1. Harris W. S. Fish oils and plasma lipid and lipoprotein metabolism in humans: a critical review. J. Lipid Res. 1989;6:785–807. - PubMed
    1. Nestel P. J. Effects of n-3 fatty acids on lipid metabolism. Annu. Rev. Nutr. 1990;10:149–167. - PubMed

Publication types

MeSH terms