

Modeling the effect of deregulated proliferation and apoptosis on the growth dynamics of epithelial cell populations in vitro
- PMID: 15475585
- PMCID: PMC1305039
- DOI: 10.1529/biophysj.104.041459
Modeling the effect of deregulated proliferation and apoptosis on the growth dynamics of epithelial cell populations in vitro
Abstract
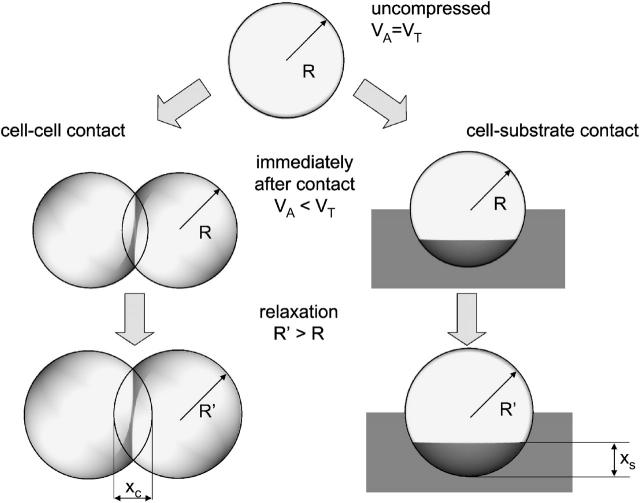
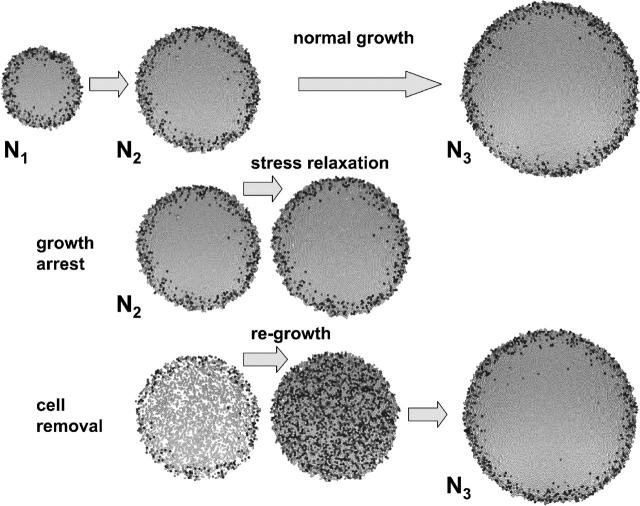
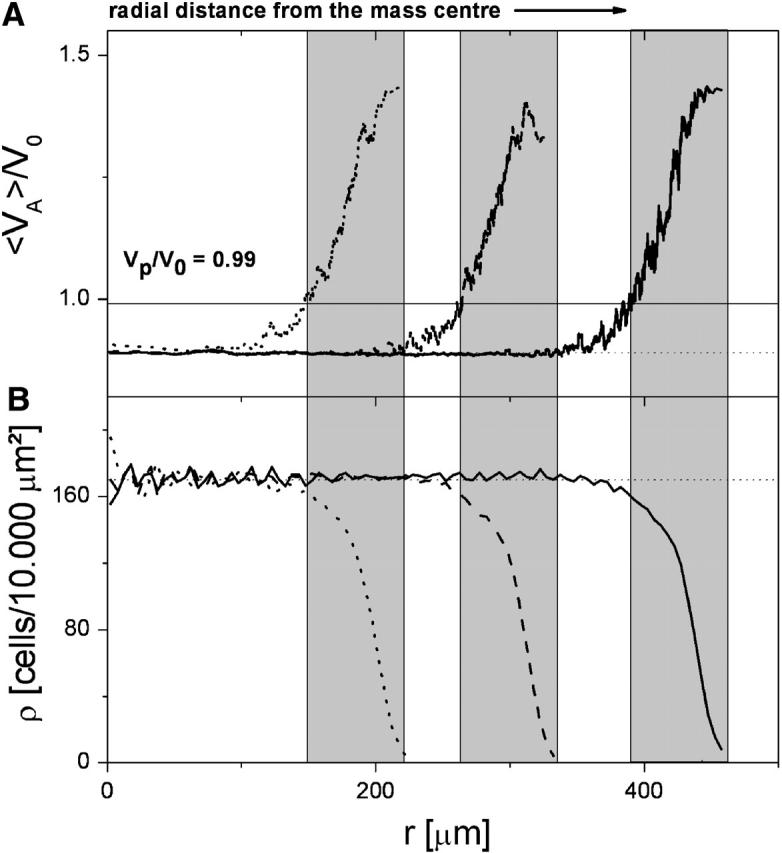
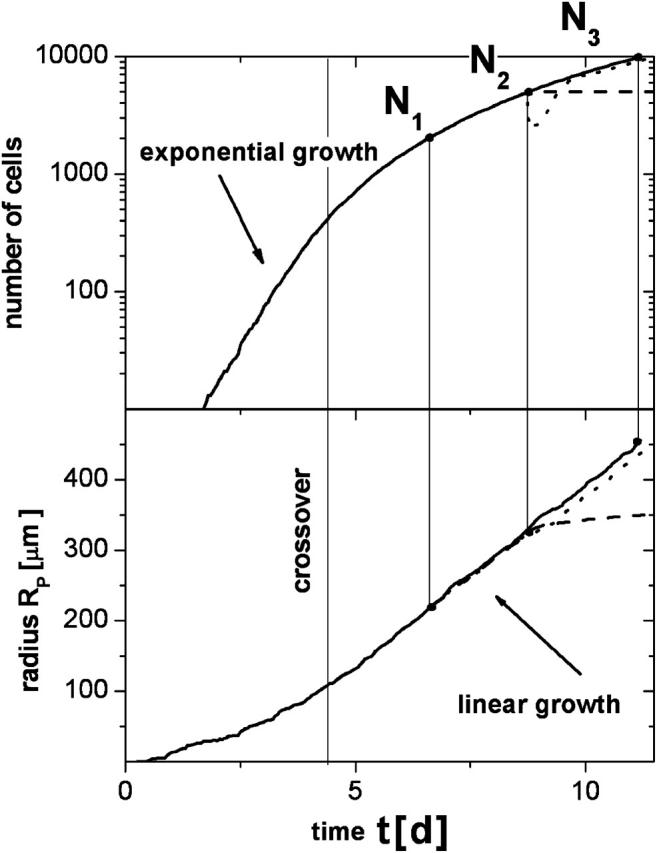
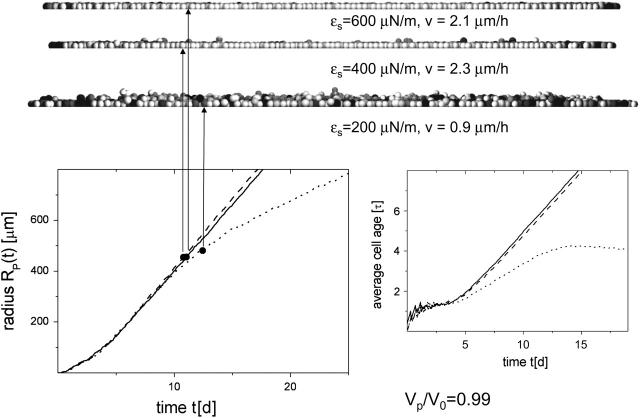
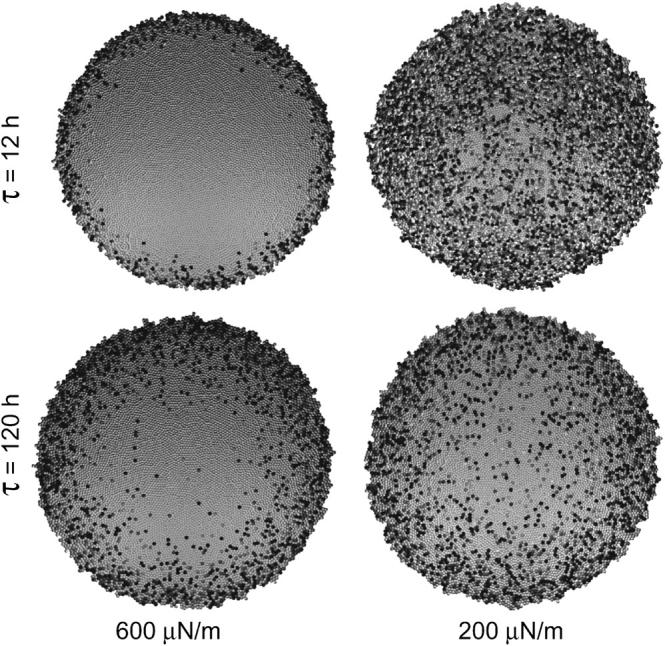
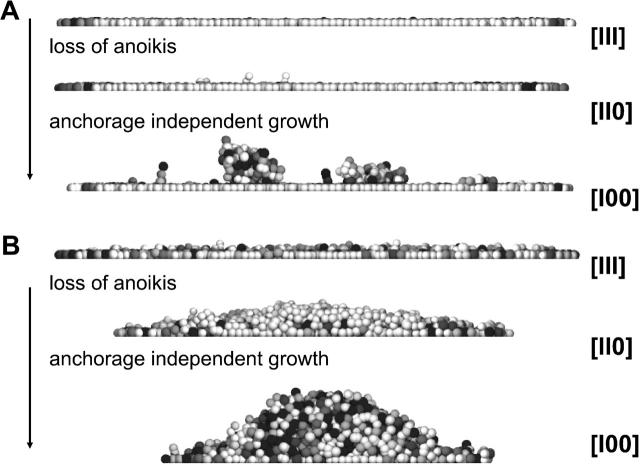
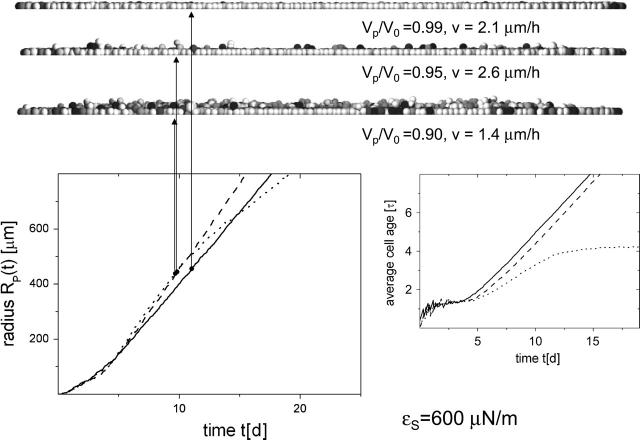
We present a three-dimensional individual cell-based, biophysical model to study the effect of normal and malfunctioning growth regulation and control on the spatial-temporal organization of growing cell populations in vitro. The model includes explicit representations of typical epithelial cell growth regulation and control mechanisms, namely 1), a cell-cell contact-mediated form of growth inhibition; 2), a cell-substrate contact-dependent cell-cycle arrest; and 3), a cell-substrate contact-dependent programmed cell death (anoikis). The model cells are characterized by experimentally accessible biomechanical and cell-biological parameters. First, we study by variation of these cell-specific parameters which of them affect the macroscopic morphology and growth kinetics of a cell population within the initial expanding phase. Second, we apply selective knockouts of growth regulation and control mechanisms to investigate how the different mechanisms collectively act together. Thereby our simulation studies cover the growth behavior of epithelial cell populations ranging from undifferentiated stem cell populations via transformed variants up to tumor cell lines in vitro. We find that the cell-specific parameters, and in particular the strength of the cell-substrate anchorage, have a significant impact on the population morphology. Furthermore, they control the efficacy of the growth regulation and control mechanisms, and consequently tune the transition from controlled to uncontrolled growth that is induced by the failures of these mechanisms. Interestingly, however, we find the qualitative and quantitative growth kinetics to be remarkably robust against variations of cell-specific parameters. We compare our simulation results with experimental findings on a number of epithelial and tumor cell populations and suggest in vitro experiments to test our model predictions.
Figures
References
-
- Andre, F., V. Rigot, J. Thimonier, C. Montixi, F. Parat, G. Pommier, J. Marvaldi, and J. Luis. 1999. Integrins and E-cadherin cooperate with IGF-I to induce migration of epithelial colonic cells. Int. J. Cancer. 83:497–505. - PubMed
-
- Aplin, A. E., A. K. Howe, and R. L. Juliano. 1999. Cell adhesion molecules, signal transduction and cell growth. Curr. Opin. Cell Biol. 11:737–744. - PubMed
-
- Balkovetz, D. F. 1999. Evidence that hepatocyte growth factor abrogates contact inhibition of mitosis in Madin-Darby canine kidney cell monolayers. Life Sci. 64:1393–1401. - PubMed
-
- Bates, R. C., N. S. Edwards, and J. D. Yates. 2000. Spheroids and cell survival. Crit. Rev. Oncol. Hematol. 36:61–74. - PubMed
Publication types
MeSH terms
Substances
LinkOut - more resources
Full Text Sources
