. 2004 Nov;78(21):11656-63.
doi: 10.1128/JVI.78.21.11656-11663.2004.

Genome-wide analyses of avian sarcoma virus integration sites

Affiliations

Genome-wide analyses of avian sarcoma virus integration sites

Anna Narezkina et al. J Virol. 2004 Nov.

Abstract

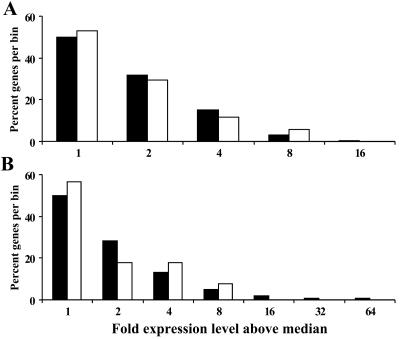
The chromosomal features that influence retroviral integration site selection are not well understood. Here, we report the mapping of 226 avian sarcoma virus (ASV) integration sites in the human genome. The results show that the sites are distributed over all chromosomes, and no global bias for integration site selection was detected. However, RNA polymerase II transcription units (protein-encoding genes) appear to be favored targets of ASV integration. The integration frequency within genes is similar to that previously described for murine leukemia virus but distinct from the higher frequency observed with human immunodeficiency virus type 1. We found no evidence for preferred ASV integration sites over the length of genes and immediate flanking regions. Microarray analysis of uninfected HeLa cells revealed that the expression levels of ASV target genes were similar to the median level for all genes represented in the array. Although expressed genes were targets for integration, we found no preference for integration into highly expressed genes. Our results provide a more detailed description of the chromosomal features that may influence ASV integration and support the idea that distinct, virus-specific mechanisms mediate integration site selection. Such differences may be relevant to viral pathogenesis and provide utility in retroviral vector design.


Figures

FIG. 1.
FIG. 1.
Distribution of ASV integration events in human chromosomes. Results are plotted as the percentage of integration events in each chromosome (n = 226). The parameters used to calculate the relative target size of each chromosome included the estimated size (19, 38) as well as corrections for differential chromosome aneuploidies, minute chromosomes, and translocations. For these corrections we used the HeLa cell karyotype and chromosome composition analyses described by Macville et al. (21). The hypothesis that the number of integration sites is proportional to chromosome length could not be rejected (χ2 = 27.6, 22 df, P = 0.194).
FIG. 2.
FIG. 2.
Analysis of ASV integration sites with respect to target transcription unit (RefSeq gene) length and flanking regions. Target gene lengths were divided into eight equal bins, and the percentage of integration events in each bin was determined. For upstream (us) and downstream (ds) regions, fixed 5-kb windows were used. These criteria were as described by Wu et al. (43) for MLV, allowing direct comparisons of the results. The hypothesis that all designated regions were equally likely to contain integration events could not be rejected (P ≥ 0.498) by the chi-square test.
FIG. 3.
FIG. 3.
Transcriptional activity of target genes. Microarray gene expression profiling was carried out for the HeLa cells as described in Materials and Methods (data set H55). Only expressed genes were used for this analysis (see Materials and Methods). HeLa gene expression levels were collected into groups based on increments of 500 arbitrary units. Each data point corresponds to the number of genes in the group (y axis, log scale) having the arbitrary units indicated on the x axis. The values for all expressed genes are indicated by filled diamonds, and ASV target gene values are indicated by filled triangles. The median value for all genes is shown as a dotted vertical line. The x axis is truncated at ca. 35,000 array units, eliminating irrelevant data points for expressed genes, for which no integrations were observed.
FIG. 4.
FIG. 4.
Relationship between transcriptional activity of target genes and frequency of ASV integration events. Expression levels of total genes and target genes were collected in bins based on their fold value above the median. Fold values above the median are indicated as 2 (one through twofold), 4 (two- through fourfold), etc., for each bin. Percentages of total genes (filled bars) or target genes (open bars) in each bin are plotted. Target site values on the x axis are truncated, eliminating higher irrelevant values for which no integrations were observed. (A) Analysis applied to the GEO GSM2145 data set. (B) Analysis applied to the H56 data set. Using Spearman's test, we determined a rank correlation between total genes and target genes (for panel A, P = 0.0083, R = 1.0; for panel B, P = 0.05, R = 0.9; R = Spearman's correlation).

References

    1. Barsov, E. V., and S. H. Hughes. 1996. Gene transfer into mammalian cells by a Rous sarcoma virus-based retroviral vector with the host range of the amphotropic murine leukemia virus. J. Virol. 70:3922-3929. - PMC - PubMed
    1. Brown, P. O., B. Bowerman, H. E. Varmus, and J. M. Bishop. 1987. Correct integration of retroviral DNA in vitro. Cell 49:347-356. - PubMed
    1. Bukrinsky, M. I., N. Sharova, T. L. McDonald, T. Pushkarskaya, W. G. Tarpley, and M. Stevenson. 1993. Association of integrase, matrix, and reverse transcriptase antigens of human immunodeficiency virus type 1 with viral nucleic acids following acute infection. Proc. Natl. Acad. Sci. USA 90:6125-6129. - PMC - PubMed
    1. Bushman, F. D. 1999. Host proteins in retroviral cDNA integration. Adv. Virus Res. 52:301-317. - PubMed
    1. Bushman, F. D. 2003. Targeting survival: integration site selection by retroviruses and LTR-retrotransposons. Cell 115:135-138. - PubMed

Publication types

LinkOut - more resources