. 2004 Nov;78(21):11678-85.
doi: 10.1128/JVI.78.21.11678-11685.2004.

Evolutionary transition toward defective RNAs that are infectious by complementation

Affiliations

Evolutionary transition toward defective RNAs that are infectious by complementation

Juan García-Arriaza et al. J Virol. 2004 Nov.

Abstract

Passage of foot-and-mouth disease virus (FMDV) in cell culture resulted in the generation of defective RNAs that were infectious by complementation. Deletions (of nucleotides 417, 999, and 1017) mapped in the L proteinase and capsid protein-coding regions. Cell killing followed two-hit kinetics, defective genomes were encapsidated into separate viral particles, and individual viral plaques contained defective genomes with no detectable standard FMDV RNA. Infection in the absence of standard FMDV RNA was achieved by cotransfection of susceptible cells with transcripts produced in vitro from plasmids encoding the defective genomes. These results document the first step of an evolutionary transition toward genome segmentation of an unsegmented RNA virus and provide an experimental system to compare rates of RNA progeny production and resistance to enhanced mutagenesis of a segmented genome versus its unsegmented counterpart.


Figures

FIG. 1.
FIG. 1.
RT-PCR amplifications used to detect defective genomes in FMDV population C-S8p260. (A) Map of the 8,115 residues of the FMDV C-S8c1 genome, excluding the internal polyribocytidylate [poly(C)] and the 3′end poly(A) (4, 10, 42). Lines indicate noncoding regions, including the 5′ untranslated region (5′ UTR) containing the poly(C) tract and the 3′ untranslated region (3′ UTR) with the terminal poly(A) tract; boxes delimit protein-coding regions. Two functional initiation AUG codons give rise to two forms of the L protease, Lab and Lb. Filled rectangles below the map indicate the position of deletions Δ417, Δ999, and Δ1017. The thin lines below the map show the RT-PCR amplification products, covering the C-S8p260 genome, used to map RNA deletions (the major class of deletion detected is indicated on the right). The location in the FMDV C-S8c1 genome of the primers used will be given upon request. RT-PCR amplifications that resulted only in DNA fragments of standard length are depicted as thick lines at the bottom of the scheme. The same RT-PCR amplifications, covering the C-S8p260p3d genome, did not detect any deletion. (B) Agarose gel showing one representative RT-PCR amplification (panel A, number 21) obtained from C-S8p260. The DNA products corresponding to standard (st) size RNA and RNAs with deletions are indicated by an arrow on the right. The DNA products obtained from C-S8p260p3d are indistinguishable from that obtained from C-S8c1. Lane M, molecular size markers (HindIII-digested φ29 DNA; the corresponding sizes [base pairs] are indicated on the left); lane −, negative control without RNA. (C) Plaque size produced by virus C-S8p260 and C-S8p260p3d. Confluent BHK-21 cell monolayers (2 × 10⁶ to 4 × 10⁶ cells per 20 cm2) were infected with serial dilutions of FMDV C-S8p260 or C-S8p260p3d, and at 24 h postinfection cell monolayers were fixed with 2% formaldehyde and stained with 2% crystal violet in 2% formaldehyde. The average diameter of the plaques produced by C-S8p260 was approximately three times smaller than that of plaques produced by C-S8p260p3d, as described in the text. Procedures for plaque assay in semisolid agar medium are described in Materials and Methods.
FIG. 2.
FIG. 2.
Killing of BHK-21 cells by FMDV C-S8p260, C-S8p260p3d, MARLS, and C-S8c1. Time needed to kill 104 BHK-21 cells as a function of the initial number of viral particles added. One representative experiment of four is shown. For standard viruses (open symbols) the time T required to produce complete cell killing is a logarithmic function of the initial number of viral particles no. Least square fits to the experimental data (continuous lines) yielded the following functions: for C-S8p260p3d, T = −2.35 ln (no) + 51.8, with a regression coefficient r2 = 0.96; for MARLS, T = −2.34 ln (no) + 52.4, r2 = 0.96; for C-S8c1, T = −3.41 ln (no) + 93.3, r2 = 0.98. For the defective RNAs containing viral population C-S8p260 (solid symbols), the time T follows instead a power-law function, such that ln (T) = ln (44844) − 0.46 ln (no), with r2 = 0.91.
FIG.3.
FIG.3.
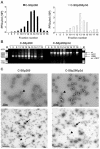
Analysis of encapsidation of viral genomic RNAs from FMDV C-S8p260 and C-S8p260p3d. (A) Sedimentation analysis of C-S8p260 and C-S8p260p3d. Sucrose density gradient infectivity profile of FMDV preparations C-S8p260 and C-S8p260p3d. Viral particles were purified as described in Materials and Methods. Infectivity was measured by titration of each gradient fraction. Fraction 1 corresponds to the top and fraction 18 to the bottom of the gradients. Each value represents the mean of triplicate assays and standard deviations (data not shown) never exceeded 15%. (B) Agarose gel electrophoresis of the products of RT-PCR amplifications of FMDV RNAs extracted from fractions of the sucrose gradient sedimentation of C-S8p260 and C-S8p260p3d. Gradient fractions from which the RNAs were analyzed correspond to those shown in panel A, and the fraction number is indicated above each lane. Amplification 21 (Fig. 1A) was used. Input RNA was diluted 100 times to make it limiting for the amplification reaction so that the amount of PCR product obtained was proportional to the input template RNA. Amplification products corresponding to the standard (st) and to the RNAs with deletions (Δ417 and Δ999 or Δ1017) are shown. Lane M, molecular size markers (HindIII-digested φ29DNA; the corresponding sizes [base pairs] are indicated on the left); lane −, negative control without RNA. (C) Electron microscopy photographs of viral populations C-S8p260 and C-S8p260p3d. Purified virus from fraction 14 of the sucrose gradients (Fig. 3A) was analyzed by electron microscopy. Negatively stained viral particles (examples indicated by arrowheads) at a magnification of ×25,000 (top frames). The measured size of the viral particles in both populations was 30 ± 0.1 nm (average of 30 measurements). Photographs of viral particles (examples indicated by arrowheads) mixed with 91-nm latex beads (examples indicated by arrows) of known size and concentration at a magnification of ×8,000 (bottom frames). C-S8p260 was not diluted; C-S8p260p3d was diluted 5 times; latex beads were diluted 20 times in both cases. Methods are detailed in Materials and Methods.

References

    1. Alberts, B., A. Johnson, J. Lewis, M. Raff, K. Roberts, and P. Walter. 2002. Molecular biology of the cell. Garland Science, New York, N.Y.
    1. Baranowski, E., C. M. Ruiz-Jarabo, and E. Domingo. 2001. Evolution of cell recognition by viruses. Science 292:1102-1105. - PubMed
    1. Baranowski, E., N. Sevilla, N. Verdaguer, C. M. Ruíz-Jarabo, E. Beck, and E. Domingo. 1998. Multiple virulence determinants of foot-and-mouth disease virus in cell culture. J. Virol. 72:6362-6372. - PMC - PubMed
    1. Belsham, G. J. 1993. Distinctive features of foot-and-mouth disease virus, a member of the picornavirus family; aspects of virus protein synthesis, protein processing and structure. Prog. Biophys. Mol. Biol. 60:241-260. - PMC - PubMed
    1. Chao, L. 1991. Levels of selection, evolution of sex in RNA viruses, and the origin of life. J. Theor. Biol. 153:229-246. - PubMed

Publication types