. 2004 Oct 13;24(41):9035-48.
doi: 10.1523/JNEUROSCI.0337-04.2004.

A population decoding framework for motion aftereffects on smooth pursuit eye movements

Affiliations

A population decoding framework for motion aftereffects on smooth pursuit eye movements

Justin L Gardner et al. J Neurosci. .

Abstract

Both perceptual and motor systems must decode visual information from the distributed activity of large populations of cortical neurons. We have sought a common framework for understanding decoding strategies for visually guided movement and perception by asking whether the strong motion aftereffects seen in the perceptual domain lead to similar expressions in motor output. We found that motion adaptation indeed has strong sequelae in the direction and speed of smooth pursuit eye movements. After adaptation with a stimulus that moves in a given direction for 7 sec, the direction of pursuit is repelled from the direction of pursuit targets that move within 90 degrees of the adapting direction. The speed of pursuit decreases for targets that move at the direction and speed of the adapting stimulus and is repelled from the adapting speed in the sense that the decrease either becomes greater or smaller (eventually turning to an increase) when tracking targets move slower or faster than the adapting speed. The effects of adaptation are spatially specific and fixed to the retinal location of the adapting stimulus. The magnitude of adaptation of pursuit speed and direction is uncorrelated, suggesting that the two parameters are decoded independently. Computer simulation of motion adaptation in the middle temporal visual area (MT) shows that vector-averaging decoding of the population response in MT can account for the effects of adaptation on the direction of pursuit. Our results suggest a unified framework for thinking, in terms of population decoding, about motion adaptation for both perception and action.


Figures
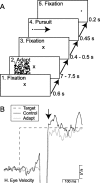
Figure 1.
Figure 1.
Schematic diagram of an example trial configuration and representative eye velocity data traces. A, The screen shots show the steps in target presentation, moving from bottom left to top right: (1) Fixation: the “x” shows a fixation point at the center of the screen; (2) Adapt: the “x” shows the persistent fixation point, and the patch of dots indicates the adapting stimulus; (3) Fixation: the “x” again shows the fixation point; (4) Pursuit: the dot shows the pursuit target, and the arrow shows its motion; (5) Fixation: the dot is the final fixation target, now moved to the edge of the screen where the pursuit target stopped. B, Example eye velocity traces for one trial. The dashed trace shows target velocity, and the black and gray traces show horizontal eye velocity in the absence and presence of a previous adapting stimulus. The downward arrow shows the onset of the 10 msec post-saccadic measurement interval. Upward deflections represent rightward motion.
Figure 9.
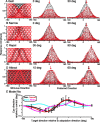
Figure 9.
An explanation for the effects of motion adaptation in a population coding framework. A-D, Effects of different mechanisms of neural adaptation on the responses of model populations of MT neurons. Mechanisms of neural adaptation were: A, reduction of the magnitude of neural responses; B, narrowing of neural direction tuning curves; C, repulsion of the neural preferred direction away from the adapting direction; D, attraction of the neural preferred direction toward the adapting direction. In A-D, the leftmost columns of graphs show the direction-tuning curves of selected neurons before and after adaptation. The middle and right columns show population responses before and after adaptation for motion of pursuit targets in two different directions relative to the adapting direction. Each point shows the response of a different model neuron from a 10,000 neuron model. In all three columns, black and red show responses before and after adaptation. E, Comparison of the effect of motion adaptation on the direction of pursuit responses to target motion in different directions. Black symbols show the mean and 95% confidence intervals from the data, whereas different colors show the best-fitting curves for models of the four different mechanisms of neural adaptation represented by A-D.
Figure 2.
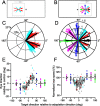
Figure 2.
The effect of adaptation on subsequent pursuit, and how adaptation generalizes to targets moving in different directions. The right and left panel summarize two sets of experiments that used different directions of pursuit target motion to explore the effects of adaptation. A, B, Schematic diagram of the target motions. The light gray outline shows the location of the adapting patch, the light gray arrow shows the direction of the adapting motion, and the “+” indicates the fixation position during adaptation. The colored arrows show the trajectory of the first 500 msec of motion of the pursuit targets. C, D, Polar plots where each arrow is a vector showing the direction and amplitude of eye velocity. The colors of the vectors correspond to the target motion vectors in A and B. In C, the bold black vectors indicate the average responses in control blocks, without adaptation, and the colored vectors indicate responses in individual trials in the adaptation block. In D, all the responses in the adaptation block have been normalized relative to the average responses in the control block so that the bold black vectors are in the directions of target motion with unity length. The colored vectors show the normalized average responses in each of seven experiments. E, F, Summary of all 29 experiments plotting normalized eye direction (E) and speed (F) as a function of the difference between the direction of motion of the pursuit target and the adapting stimulus. The colored symbols plot the data from D, the gray symbols plot the results for 22 additional experiments, and the open circles plot the averages across all experiments. Error bars show the 95% confidence intervals.
Figure 3.
Figure 3.
Failure of adaptation to generalize to the opposite hemifield from the adapting stimulus. A, B, Stimulus configuration. The light gray patch shows the location of the adapting stimulus, the gray arrow shows the direction of the adapting motion, the “+” indicates the fixation position, and the colored arrows show pursuit targets presented in the same (A) or opposite (B) hemifields from the adapting stimulus. C, D, Polar plots where each vector shows the normalized average eye velocity: black vectors show control responses, and colored vectors show responses from individual experiments in the adaptation block. The colors correspond to the arrows in A and B, and the two plots show responses for pursuit targets that moved through the same (C) or opposite (D) hemifield from the adapting stimulus. E, F, Summary of average effects of adaptation showing the normalized direction (E) and speed (F) in the adapting block as a function of the difference between the directions of motion of the pursuit target and the adapting stimulus. Red and black symbols show responses for pursuit targets in the same or opposite hemifield from the adapting stimulus. Error bars show 95% confidence intervals.
Figure 4.
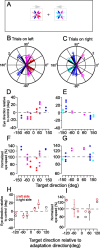
Figure 4.
Effects of simultaneous adaptation with different directions of motion in the two visual hemifields. A, Stimulus configuration. The light gray patches show the locations of the two adapting stimuli, the gray arrows show the direction of the adapting motion in each patch, the “+” indicates the fixation position, and the colored arrows show pursuit targets presented in the two hemifields. B, C, Polar plots where each vector shows the normalized average eye velocity: black vectors show control responses, and colored vectors show responses from individual experiments in the adaptation block. The colors correspond to the arrows in A, and the two plots show responses for pursuit targets that moved through the left (B) or right (C) hemifield. D, E, Normalized eye direction is plotted as a function of the absolute target direction for pursuit targets that moved through the left (D) or right (E) hemifield. F, G, Normalized eye speed is plotted as a function of the absolute target direction for pursuit targets that moved through the left (F) or right (G) hemifield. In D-G, the colors of the symbols correspond to the arrows in A. H, I, Eye direction (H) and speed (I) as a function of the difference between the directions of motion or the pursuit target and the adapting stimulus. Red and black symbols show average responses across all experiments for targets that moved through the left and right visual hemifield, respectively. Error bars show 95% confidence intervals when there was enough data to compute them by bootstrapping.
Figure 5.
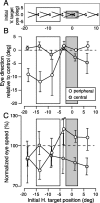
Figure 5.
Spatial generalization of adaptation tested for peripheral and central adapting locations. A, Stimulus configuration. White and gray rectangles indicate the locations of the two adapting patches, used in different experiments, and arrows indicate the first 300 msec of motion of the pursuit targets. B, C, Normalized eye direction (B) and speed (C) are plotted as a function of the starting location of the pursuit target along the horizontal axis. White and gray symbols show effects of peripheral and central adaptation, respectively. Error bars show 95% confidence intervals. White and gray rectangles indicate the region of the visual field covered by the peripheral and central adapting stimuli. Horizontal dashed lines show control values of eye direction and speed. For eye direction, negative values indicate that the response was repelled away from the direction of the adapting motion.
Figure 6.
Figure 6.
Time course of adaptation effects on post-saccadic pursuit. Normalized pursuit eye direction (A) and speed (B) are plotted as a function of time of the measurement relative to the saccade. Negative values of normalized eye direction indicate that the response was repelled away from the direction of the adapting motion. Error bars show 95% confidence intervals.
Figure 7.
Figure 7.
Effects of adaptation on the post-saccadic eye speed evoked by different speeds of target motion in the adapting direction. The graph plots normalized eye speed as a function of the difference between target speed and adapting speed. Targets moved at 4, 8, 16, 24, 32, and 48°/sec, and the adapting stimulus always moved at 16°/sec. Error bars show 95% confidence intervals. The target speed of 48°/sec (the point at 32°/sec on the graph) was only tested in two experiments and therefore lacks error bars.
Figure 8.
Figure 8.
Absence of correlation in the magnitudes of the adaptations of eye speed versus eye direction. Data are plotted for each pursuit trial in which the direction of target motion was 30° (A) or 60° (B) from the adapting direction. Each point represents the average effect from ∼20 trials in a single daily experiment. Negative values of normalized eye direction on the abscissa indicate that the response was repelled away from the direction of the adapting motion.

References

    1. Addams R (1834) An account of a peculiar optical phaenomenon seen after having looked at a moving body. Lond Edin Philos Mag J Sci 5: 373-374.
    1. Albright TD (1984) Direction and orientation selectivity of neurons in visual area MT of the macaque. J Neurophysiol 52: 1106-1130. - PubMed
    1. Bahill AT, Clark MR, Stark L (1975) The main sequence, a tool for studying human eye movements. Math Biosci 24: 191-204.
    1. Barlow HB, Hill RM (1963) Evidence for a physiological explanation of the waterfall phenomenon and figural after-effects. Nature 200: 1345-1347. - PubMed
    1. Barnes GR, Asselman PT (1991) The mechanism of prediction in human smooth pursuit eye movements. J Physiol (Lond) 439: 439-461. - PMC - PubMed

Publication types

LinkOut - more resources