. 2004 Oct 13;24(41):9127-37.
doi: 10.1523/JNEUROSCI.2113-04.2004.

Spike timing of distinct types of GABAergic interneuron during hippocampal gamma oscillations in vitro

Affiliations

Spike timing of distinct types of GABAergic interneuron during hippocampal gamma oscillations in vitro

Norbert Hájos et al. J Neurosci. .

Abstract

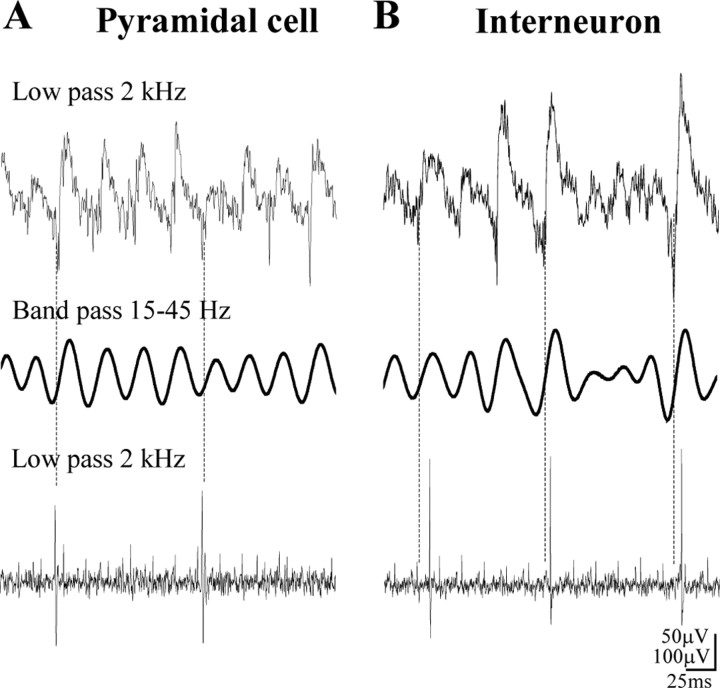
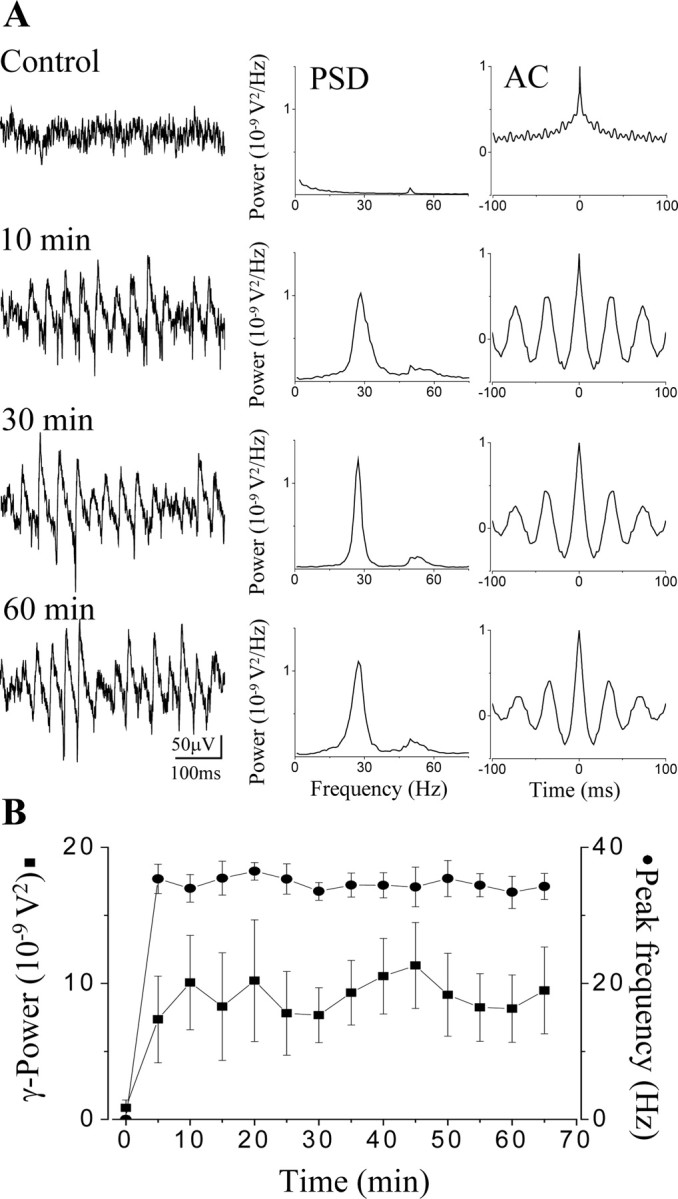
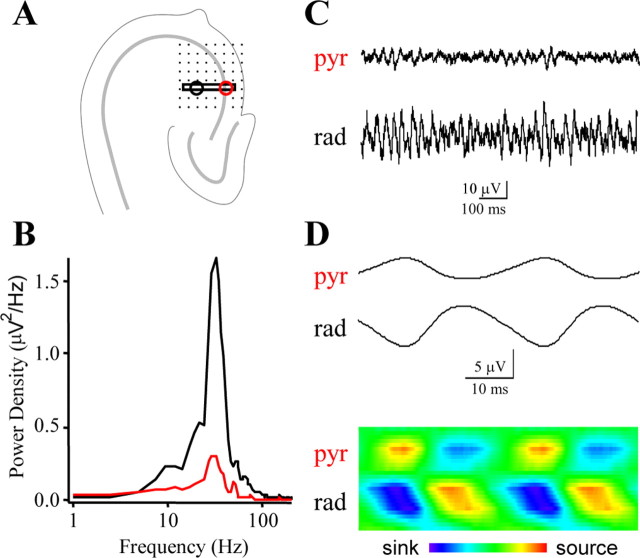
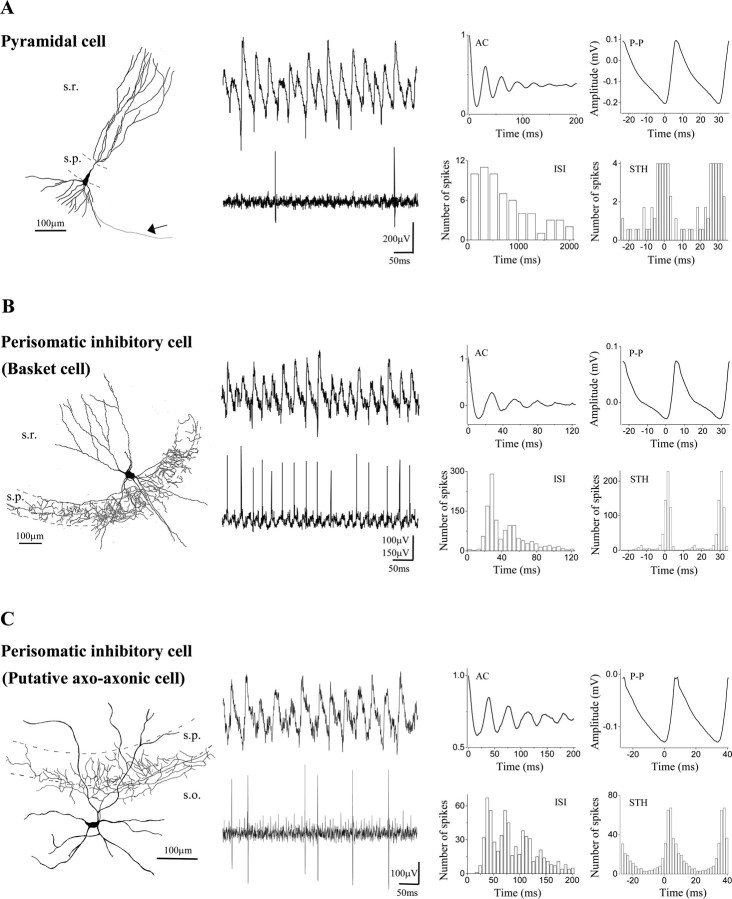
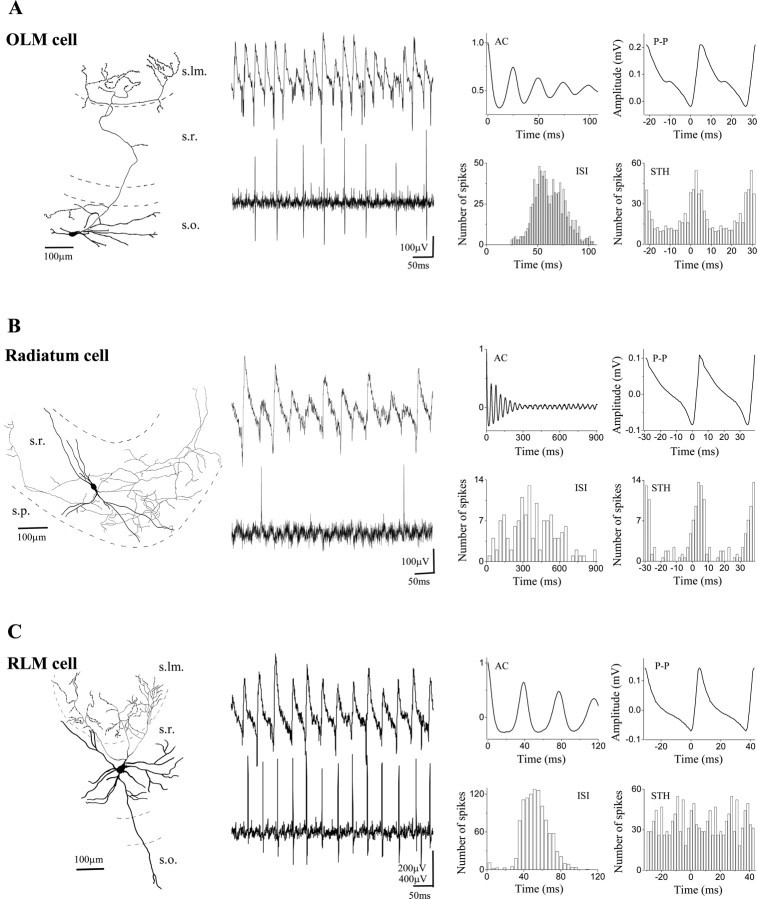
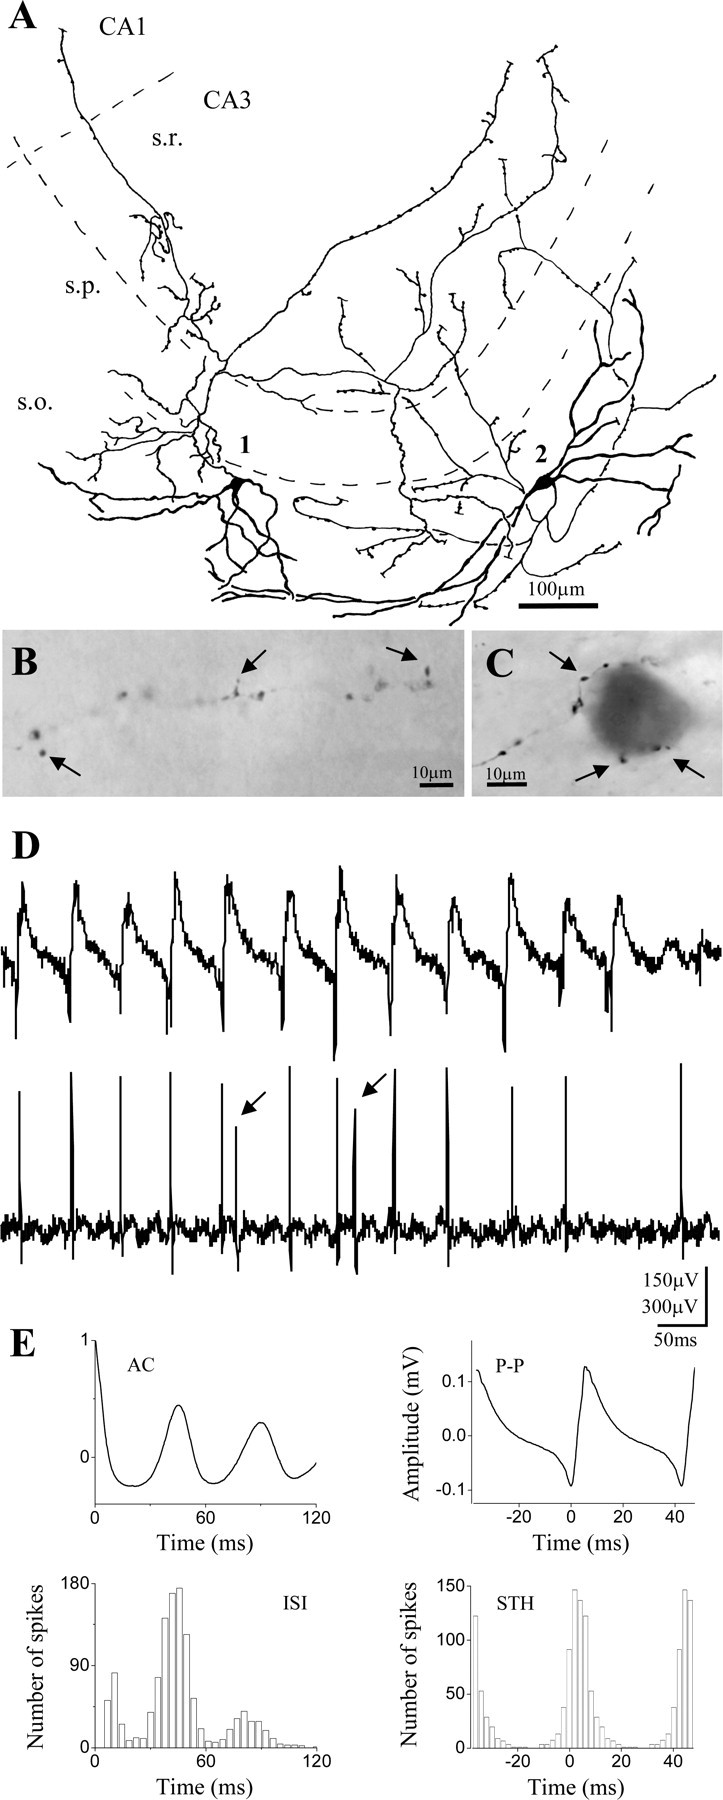
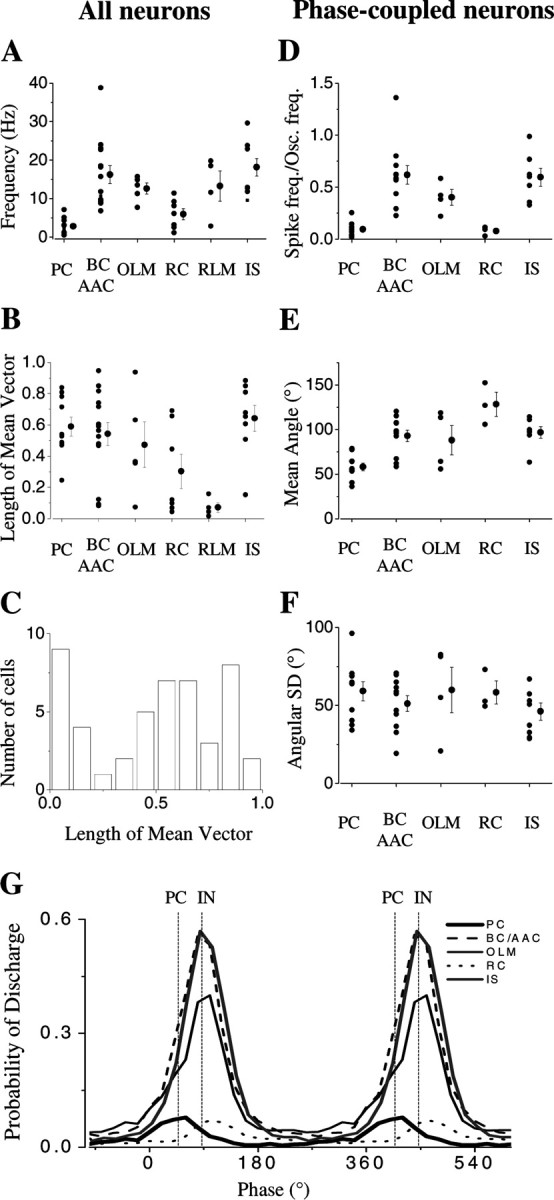
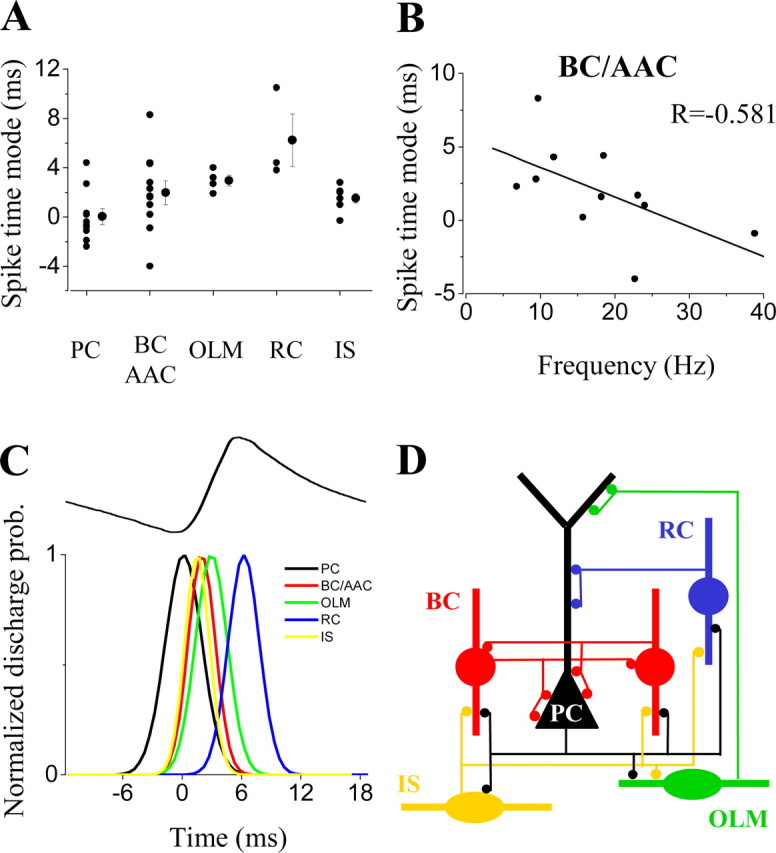
Gamma frequency (30-100 Hz) network oscillations occur in the intact hippocampus during awake, attentive behavior. Here, we explored the underlying cellular mechanisms in an in vitro model of persistent gamma-frequency oscillations, induced by bath application of 20 microm carbachol in submerged hippocampal slices at 30 +/- 1 degrees C. Current-source density analysis of the field oscillation revealed a prominent alternating sink-source pair in the perisomatic and apical dendritic regions of CA3. To elucidate the active events generating these extracellular dipoles, we examined the firing properties of distinct neuron types. Visually guided unit recordings were obtained from individual CA3 neurons followed by intracellular labeling for anatomical identification. Pyramidal cells fired at 2.82 +/- 0.7 Hz, close to the negative peak of the oscillation (0.03 +/- 0.65 msec), and often in conjunction with a negative spike-like component of the field potential. In contrast, all phase-coupled interneurons fired after this negative peak. Perisomatic inhibitory interneurons fired at high frequency (18.1 +/- 2.7 Hz), shortly after the negative peak (1.97 +/- 0.95 msec) and were strongly phase-coupled. Dendritic inhibitory interneurons fired at lower frequency (8.4 +/- 2.4 Hz) and with less fidelity and a longer delay after the negative peak (4.3 +/- 1.1 msec), whereas interneurons with cell body in the stratum radiatum often showed no phase relationship with the field oscillation. The phase and spike time data of individual neurons, together with the current-source density analysis, support a synaptic feedback model of gamma oscillations primarily involving pyramidal cells and inhibitory cells targeting their perisomatic region.


Figures

Figure 3.
Figure 3.
Cholinergically induced gamma oscillations in the pyramidal cell layer consist of slow and fast components. Field recordings low-pass-filtered at 2 kHz contain an oscillatory component, which is often decorated at the negative part with spike-like elements (top row). For the detailed analysis of gamma oscillations, traces were bandpass filtered in the frequency range of 15-45 Hz using a high-order FIR filter in both directions to conserve the phase of the oscillation. Note that negative peaks of the oscillation on filtered signals are shifted compared with those seen in the raw recordings (dashed line). Comparison of unit recordings during oscillations obtained from a pyramidal cell (A) and from an interneuron [post hoc identified as an OLM cell (B)] revealed that firing of the pyramidal cell took place at the negative peak of the gamma oscillation (dashed line), whereas the OLM cell discharged with a short delay (bottom row).
Figure 1.
Figure 1.
Carbachol-induced gamma oscillations in submerged hippocampal slices. A, A representative experiment of synchronous activity after bath application of 20 μm carbachol, a cholinergic agonist, demonstrating the temporal stability of the oscillation. Field potential recordings were obtained in the stratum pyramidale of the CA3 hippocampal region. During the control period, no rhythmicity can be seen. Drug application induced a stable oscillation in 10 min that was sustained for at least 1 hr. Corresponding power spectra (PSD) and autocorrelation (AC) of the recordings at different time points were calculated from 1-min-long epochs. B, Stability of the gamma oscillations (gamma power, square; peak frequency, circle) in submerged slices illustrated on a summary graph obtained from six different experiments. Data points represent mean ± SEM.
Figure 2.
Figure 2.
CSD analysis of cholinergically induced oscillations in submerged slices. A, Network oscillations induced by 20 μm carbachol were recorded across the CA3 subfield from slices mounted on 64-electrode arrays. The sample recordings from the stratum pyramidale and stratum radiatum shown in C and D were taken from the electrodes marked by the red and black circles, respectively. The black box marks the electrodes used for calculating the current source density profile in D. B, The power spectral density functions of the field oscillation in the stratum pyramidale (red) and stratum radiatum (black) both revealed peaks at 32 Hz. C, Example traces from the stratum pyramidale (top) and stratum radiatum (bottom) show a clear reversal in the polarity of the field oscillation between these layers. D, Peak-to-peak cycle averages were calculated for the gamma-frequency oscillations, using a reference from the stratum pyramidale (marked with red circle in A). The average period was 29 msec. The peak-to-peak averages were used to construct CSD profiles for the gamma-frequency oscillations, which revealed alternating sink (blue) and source (red) pairs in the stratum pyramidale and stratum radiatum.
Figure 4.
Figure 4.
Firing properties of pyramidal cells and perisomatic inhibitory neurons during cholinergically induced gamma oscillations. Camera lucida reconstructions of intracellularly labeled neurons are shown in the left column. A, Pyramidal cell located at the border of strata pyramidale and oriens had an extensive dendritic arborization outside the pyramidal cell layer. In this case, only the main axon projecting toward the fimbria-fornix (arrow) could be followed. B, Multipolar basket cell with soma in the stratum lucidum gave rise to a dense axonal ramification almost completely restricted to the stratum pyramidale. C, A putative axo-axonic cell with axon collaterals at the border of strata pyramidale and oriens, showing short vertical and oblique axon segments studded with boutons. The cell body and the large part of the dendritic arbor were found in the stratum oriens, but some dendrites also penetrated into the strata pyramidale and lucidum. The middle panel of the figure shows representative traces for each cell illustrating the different firing activity during gamma oscillations. The pyramidal cell discharged at 1.1 Hz, the basket cell at 22.8 Hz, and the axo-axonic cell at 11.8 Hz. The right panels show autocorrelograms (AC), interspike interval histograms (ISI), peak-to-peak averages (P-P), and spike time histograms (STH) for each cell type calculated from a 3-min-long epoch for the pyramidal cell and from 1-min-long epochs for interneurons. Spike time histograms show that the pyramidal cell fired at the negative peak of the oscillations, whereas interneurons fired with a short delay. Note that perisomatic inhibitory cells follow the oscillations with high fidelity, as can be seen by comparing the ISI histograms with the autocorrelograms. s.r., Stratum radiatum; s.p., stratum pyramidale; s.o., stratum oriens.
Figure 5.
Figure 5.
Behavior of dendritic inhibitory interneurons during carbachol-induced network oscillations. Camera lucida reconstructions of an OLM cell (A), a radiatum cell (B), and an RLM cell (C) are shown. A, Both the cell body and the dendritic arbor of the OLM cell were found in the stratum oriens, whereas most of the varicose axon collaterals were restricted to the stratum lacunosum-moleculare. B, The dendritic tree, as well as the axon cloud of the radiatum cell, were located in the stratum radiatum. C, The RLM cell with the majority of dendrites in the stratum radiatum exclusively projected to the stratum lacunosum-moleculare. Representative recordings for each cell type demonstrate the different firing characteristics (middle panel). The spike frequency was 15.7 Hz for the OLM cell, 2.5 Hz for the radiatum cell, and 18.5 Hz for the RLM cell. The corresponding data calculated from 1-min-long recording epochs are illustrated in the right column. As seen on the STHs compared with the P-P, both the OLM cell and the radiatum cell fired phased-coupled to the oscillations after the negative peak. The ISIs together with ACs indicate that the OLM cell discharged on every second or third cycle, whereas the radiatum cell was much less active. In contrast, the firing of the RLM cell showed no phase relationship indicated by uniform distribution in the spike time histogram, although both the oscillations and the discharge of the neuron were prominent shown by the AC and ISI histogram, respectively. s.lm., Stratum lacunosum-moleculare.
Figure 6.
Figure 6.
Firing of IS cells is tightly coupled to gamma oscillation. A-C, Light microscopic reconstruction of two intracellularly filled putative IS cells. The cell bodies and the dendritic arbors for both neurons were found in the stratum oriens (A). The main axon originating from the somata gave rise to several collaterals predominantly arborizing in strata oriens and radiatum. Long axon branches reaching the CA3c region as well as penetrating into the CA1 were often decorated by drumstick-like boutons (B, arrows), whereas other varicose collaterals formed multiple appositions (arrows) with nonpyramidal cell bodies in the strata oriens or radiatum (C). D, Raw traces showing the firing activity of cell 2 during the oscillation (20.8 Hz). Arrows mark the second spike within an oscillation cycle. E, Results calculated from a 1-min-long recording epoch showing that the neuron discharged on the ascending phase of the oscillation as indicated on the STH in conjunction with the P-P. Its spiking followed the oscillation with a high fidelity as demonstrated by the ISI together with the AC.
Figure 7.
Figure 7.
Phase relationship between field oscillations and spiking of identified neurons during cholinergically induced gamma oscillations. A-C, Analysis in all neurons. A, B, Frequency and length of mean vector plotted for all morphologically identified neurons in each cell category. Note that in all interneuron groups, at least one cell was found not to be significantly phase-coupled. C, Histogram of the length of mean vector, including data for all cells showing a bimodal distribution. Values of the mean vector <0.2 suggested a uniform distribution (Rao's spacing test and Rayleigh's uniformity test, p > 0.05). Further detailed analysis was performed only on phase-coupled neurons. D-F, Firing rate divided by oscillation frequency (D), mean angle (E), and angular SD, indicating the precision of phase-coupling (F) varied substantially among the cell types. Individual points on the plots represent data for individual cells, whereas the mean ± SEM is indicated on the right for each neuron type. PC, Pyramidal cell; BC, basket cell; AAC, axo-axonic cell; OLM, interneurons in the stratum oriens projecting to the stratum lacunosum-moleculare; RC, interneurons with both dendritic and axonal arborizations restricted to the stratum radiatum; RLM, interneurons with dendritic tree in the stratum radiatum projecting into the stratum lacunosum-moleculare; IS, cells with morphological appearance resembling interneuron-selective interneurons. G, Average phase histograms of unit activity during gamma oscillations showing that PC discharge is followed by discharge of the various types of interneuron (IN). Dotted vertical lines indicate the mean of the mode of the phase angle for pyramidal cells and all classes of interneurons, respectively.
Figure 8.
Figure 8.
Time relationship between field potentials and spiking activity of identified hippocampal neurons during oscillations. A, Mode of the spike time histograms relative to the time of the negative peak of the average oscillation plotted for the different types of hippocampal neurons. The individual points on the plot represent data for individual cells, whereas the mean ± SEM is indicated on the right for each type of neuron. B, Negative correlation between the rate of firing of individual perisomatic inhibitory neurons (basket and axo-axonic cells) and their relative spike times. Cells with higher discharge rate tend to fire closer to the negative peak. C, Time sequence of firing of different neuron types during an oscillatory cycle. Top trace shows representative average field oscillatory wave. Pyramidal cells fired at the negative peak of the oscillation followed by the interneurons. Gaussian functions were fitted to the spike time distribution for each type of neuron, and the average mean and SD were used to represent each cell class as a Gaussian function. D, Schematic diagram of the connectivity among phase-coupled neuron types in the CA3 hippocampal circuitry taking part in the gamma oscillation.

References

    1. Acsády L, Gorcs TJ, Freund TF (1996) Different populations of vasoactive intestinal polypeptide-immunoreactive interneurons are specialized to control pyramidal cells or interneurons in the hippocampus. Neuroscience 73: 317-334. - PubMed
    1. Bartos M, Vida I, Frotscher M, Meyer A, Monyer H, Geiger JR, Jonas P (2002) Fast synaptic inhibition promotes synchronized gamma oscillations in hippocampal interneuron networks. Proc Natl Acad Sci USA 99: 13222-13227. - PMC - PubMed
    1. Boddeke HW, Best R, Boeijinga PH (1997) Synchronous 20 Hz rhythmic activity in hippocampal networks induced by activation of metabotropic glutamate receptors in vitro. Neuroscience 76: 653-658. - PubMed
    1. Bragin A, Jando G, Nadasdy Z, Hetke J, Wise K, Buzsáki G (1995) Gamma (40-100 Hz) oscillation in the hippocampus of the behaving rat. J Neurosci 15: 47-60. - PMC - PubMed
    1. Buzsáki G, Chrobak JJ (1995) Temporal structure in spatially organized neuronal ensembles: a role for interneuronal networks. Curr Opin Neurobiol 5: 504-510. - PubMed

Publication types

MeSH terms

Substances

LinkOut - more resources