. 2004 Oct 27;23(21):4275-85.
doi: 10.1038/sj.emboj.7600421. Epub 2004 Oct 14.

Epigenetic silencing of the c-fms locus during B-lymphopoiesis occurs in discrete steps and is reversible

Affiliations

Epigenetic silencing of the c-fms locus during B-lymphopoiesis occurs in discrete steps and is reversible

Hiromi Tagoh et al. EMBO J. .

Abstract

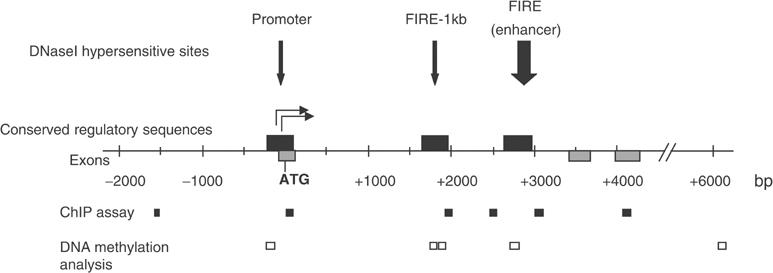
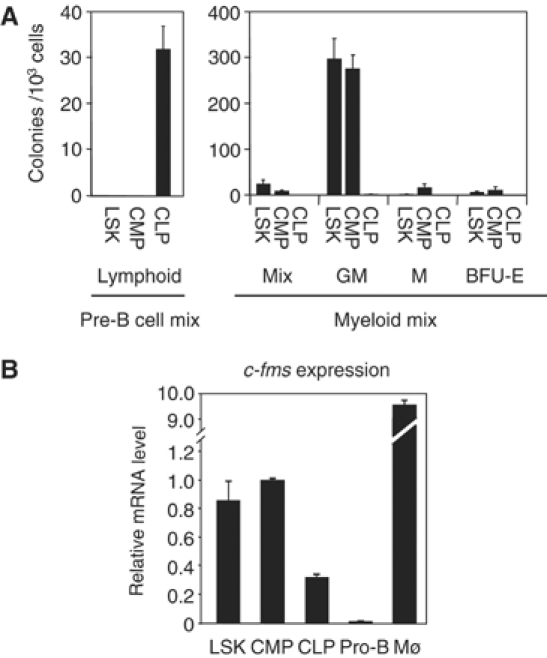
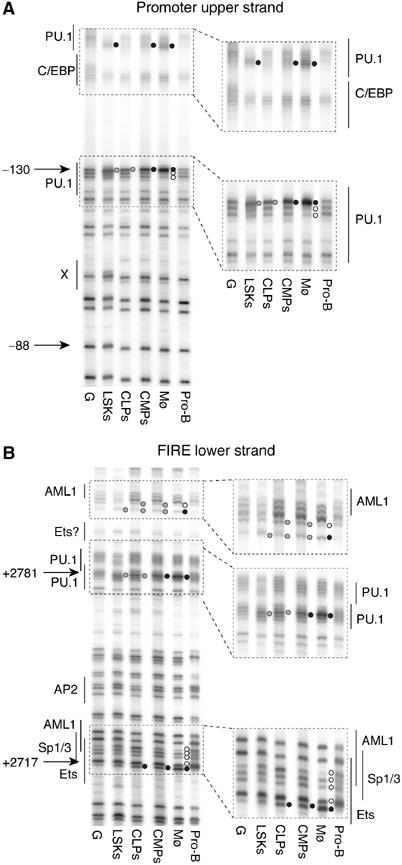
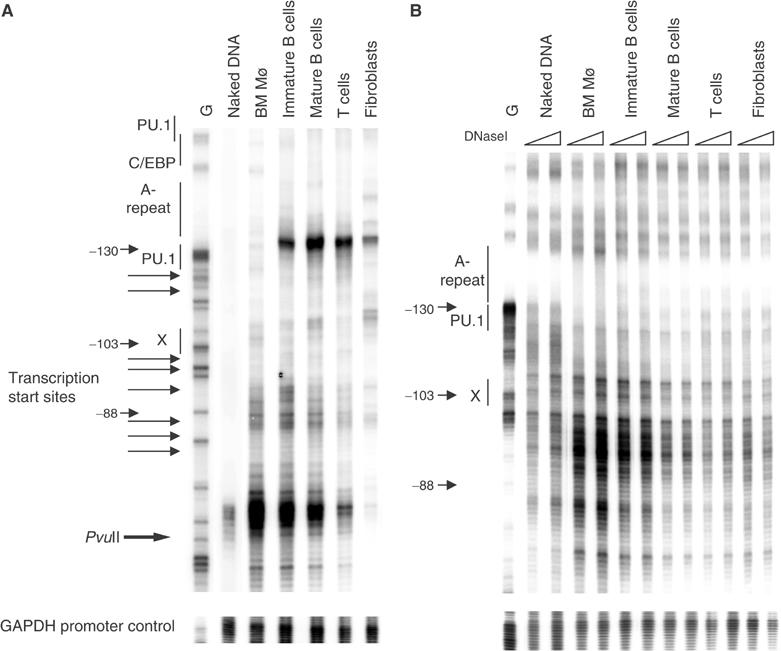
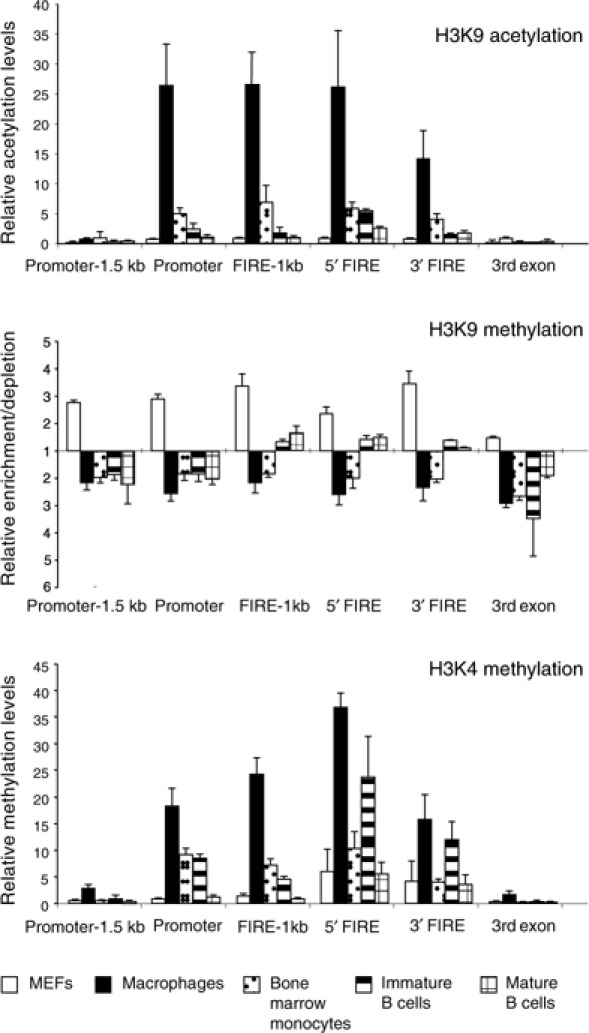
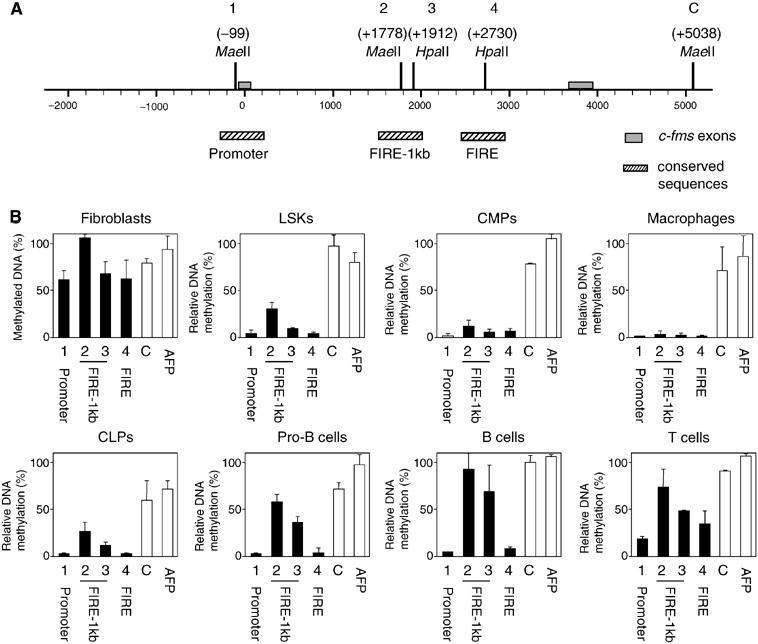
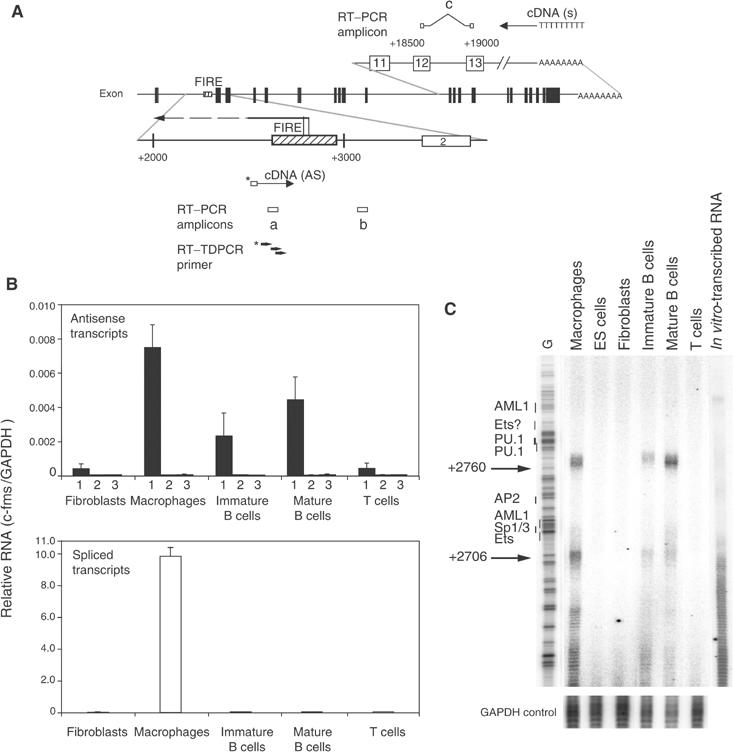
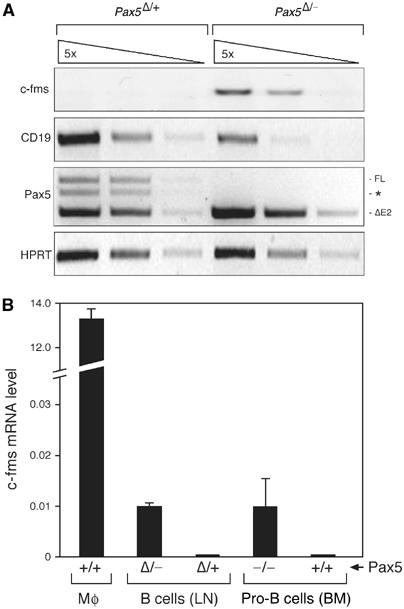
The murine c-fms (Csf1r) gene encodes the macrophage colony-stimulating factor receptor, which is essential for macrophage development. It is expressed at a low level in haematopoietic stem cells and is switched off in all non-macrophage cell types. To examine the role of chromatin structure in this process we studied epigenetic silencing of c-fms during B-lymphopoiesis. c-fms chromatin in stem cells and multipotent progenitors is in the active conformation and bound by transcription factors. A similar result was obtained with specified common myeloid and lymphoid progenitor cells. In developing B cells, c-fms chromatin is silenced in distinct steps, whereby first the binding of transcription factors and RNA expression is lost, followed by a loss of nuclease accessibility. Interestingly, regions of de novo DNA methylation in B cells overlap with an intronic antisense transcription unit that is differently regulated during lymphopoiesis. However, even at mature B cell stages, c-fms chromatin is still in a poised conformation and c-fms expression can be re-activated by conditional deletion of the transcription factor Pax5.


Figures

Figure 1
Figure 1
Map of the c-fms regulatory region. DHSs present in macrophages are shown as vertical arrows. Numbers indicate the nucleotide position relative to the ATG start codon. Grey boxes represent exons, and black boxes show regions conserved between human and mouse. The main transcription start sites are indicated as horizontal arrows. Amplicons for ChIP assays and DNA methylation analysis are indicated.
Figure 2
Figure 2
Characterization of purified LSKs, CLPs and CMPs. (A) Colony-forming activities of LSKs, CLPs and CMPs. Sorted cells were seeded at a density of 1000 cells/ml in methylcellulose medium containing IL-7, SCF and VEGF for lymphoid assays (pre-B cell mix), and IL-3, IL-6, SCF and Epo for myelo-erythroid assays (GM, M, Mix, BFU-E). Colonies were scored at days 8–10. The results are represented as the mean value of four independent experiments. (B) Expression of c-fms mRNA in purified LSKs, CLPs, CMPs, pro-B cells and macrophages (Mø). Gene expression was measured by RT–PCR. Arbitrary units were calculated relative to the expression level in CMPs. The bars represent the mean value of two independent experiments.
Figure 3
Figure 3
Transcription factor binding to the c-fms promoter and FIRE is lost in pro-B cells. DMS footprinting analysis of promoter (upper strand) (A) and FIRE (lower strand) (B). The numbers on the left indicate the nucleotide position relative to the ATG codon. Transcription factor-binding sites and their nature as determined by ChIP assays and in vitro DNA–protein interaction studies (Tagoh et al, 2002; Follows et al, 2003) are indicated. Black circles indicate hypermethylated guanines, and open circles indicate hypomethylated guanines compared with DMS-treated naked DNA (G). Grey circles indicate weaker footprints. From left to right: DMS-treated naked DNA (G), purified cells (LSKs, CLPs, CMPs, bone marrow macrophages (Mø), freshly purified pro-B cells from RAG2−/− mice).
Figure 4
Figure 4
Chromatin at the c-fms promoter is in a partially active conformation in B cells. (A) From left to right: In vivo MNase footprinting experiment with naked DNA and chromatin prepared from the indicated cell populations using primers specific for the c-fms promoter (upper panel) or the GAPDH promoter (lower panel). Horizontal arrows indicate the position of transcription start sites. The PvuII site is at position −66 bp. (B) In vivo DNaseI footprinting experiment with naked DNA and the indicated cell populations using increasing amounts of DNaseI (20 and 40 U) G: G-reaction of naked DNA. For further description, see Figure 3.
Figure 5
Figure 5
Alterations of histone H3 modifications inside and outside the c-fms regulatory region during B-lymphopoiesis. ChIP assays using antibodies specific for acetylated H3K9 (A), dimethylated H3K9 (B) and trimethylated H3K4 (C). The region-specific enrichment by ChIP was examined by real-time PCR using primers indicated in Figure 1. DNA enrichment was calculated as described in Materials and methods. Bars represent the mean±s.d. of quantifications from two to four separate immunoprecipitations analysed in duplicate.
Figure 6
Figure 6
DNA methylation at specific c-fms cis-regulatory elements during haematopoietic differentiation. (A) Schematic representation of the position of the recognition sites of the differentially methylation-sensitive restriction enzymes MaeII and HpaII in the c-fms promoter and first intron (1–4: regulatory regions; C: downstream control region). Relevant DNA sequences and the position of transcription factor-binding sites are depicted in Supplementary Figure 4. (B) DNA methylation status at specific c-fms cis-regulatory (black bars) and control regions (white bars) in the indicated cell types. After HpaII or MaeII digestion of genomic DNA from each cell type, the amount of undigested DNA was measured by real-time PCR. The bars represent the mean value±s.d. of two to four independent experiments analysed in duplicate. AFP: α-fetoprotein promoter.
Figure 7
Figure 7
Antisense (AS) RNA starting at FIRE is expressed in macrophages and B cells. (A) Schematic representation of the position of primers used to carry out cDNA synthesis as well as real-time PCR amplicons. cDNA specific for AS RNA was synthesized from a biotinylated primer (indicated below the map), whereas an oligo (dT) primer was used to detect spliced transcripts (indicated above the map). Primer sets (a) (FIRE06) and (b) (3′-FIRE) were used to detect AS RNA transcribed from FIRE and from downstream of FIRE, respectively. Primer set (a) (c-fms QPCR), which is located between exons 12 and 13, was used to detect spliced sense transcripts. Black boxes in the map and numbered white boxes in the top and bottom map represent c-fms exons. Dashed boxes in the bottom row represent FIRE sequences. The numbers indicate the nucleotide position relative to the ATG start codon. The localization of the AS transcript is indicated as a horizontal arrow and the two AS transcription start sites mapped in (C) are indicated. (B) Expression of sense and AS RNA at the c-fms locus as assayed by real-time PCR. The top panel represents signals obtained with primer pair (a) measuring AS RNA originating from FIRE (1), signals from genomic DNA contamination (2) (assays with primer pair (a) but without reverse transcriptase) and signals obtained with primer pair (b) (3). The bottom panel represents spliced sense transcripts detected by primer pair (c). Bars represent mean value±s.d. of two to four independent experiments analysed in duplicate. (C) Determination of the start site of the AS RNA within FIRE. RT–TDPCR was performed as described in Materials and methods using RNA prepared from the indicated cell types and from in vitro-synthesized RNA as a control for cDNA synthesis and amplification artefacts. An RT–TDPCR reaction examining the GAPDH gene was performed as internal control. A sequence reaction was run on the gel alongside the RT–TDPCR samples and the positions of transcription factor-binding sites within FIRE are indicated. This result was confirmed in two independently performed experiments.
Figure 8
Figure 8
Epigenetic silencing of c-fms is reversible in mature B cells. (A) Mature control and Pax5-deficient B cells were isolated free of contaminating non-B cells from the lymph nodes (LN) of Pax5F/+ CD19-cre mice (abbreviated as Pax5Δ/+) or Pax5F/−CD19-cre (Pax5Δ/−) mice (Horcher et al, 2001) prior to RNA preparation and cDNA synthesis as described in Supplementary Figure 5 and Materials and methods. The cDNA of both cell types was normalized for equal expression of the hypoxanthine phosphoribosyltransferase (HPRT) gene followed by analysis of the indicated transcripts by semiquantitative RT–PCR of five-fold serial cDNA dilutions. Pax5 transcripts were amplified from exons 1A to 5. ΔE2 denotes the truncated transcript of the Pax5Δ allele lacking exon 2 in contrast to the full-length transcript (FL). A PCR artefact consisting of an FL/ΔE2 cDNA hybrid is indicated by an asterisk. All PCR fragments had the correct size, expect for the respective spliced mRNA. (B) Real-time PCR quantification of c-fms mRNA levels in macrophages (Mø), sorted lymph node (LN) B cells and in vitro-cultured bone marrow (BM) pro-B cells of the indicated Pax5 genotypes. The c-fms mRNA level of the CMP was used as reference, which was arbitrarily assigned a value of 1.

References

    1. Adolfsson J, Borge OJ, Bryder D, Theilgaard-Monch K, Astrand-Grundstrom I, Sitnicka E, Sasaki Y, Jacobsen SE (2001) Upregulation of Flt3 expression within the bone marrow Lin−Sca1+c-Kit+ stem cell compartment is accompanied by loss of self-renewal capacity. Immunity 15: 659–669 - PubMed
    1. Akashi K, Traver D, Miyamoto T, Weissman IL (2000) A clonogenic common myeloid progenitor that gives rise to all myeloid lineages. Nature 404: 193–197 - PubMed
    1. al-Bhadra M, Leibovitch BA, Gandhi SG, Rao M, Bhadra U, Birchler JA, Elgin SC (2004) Heterochromatic silencing and HP1 localization in Drosophila are dependent on the RNAi machinery. Science 303: 669–672 - PubMed
    1. Bird A (2002) DNA methylation patterns and epigenetic memory. Genes Dev 16: 6–21 - PubMed
    1. Borzillo GV, Ashmun RA, Sherr CJ (1990) Macrophage lineage switching of murine early pre-B lymphoid cells expressing transduced fms genes. Mol Cell Biol 10: 2703–2714 - PMC - PubMed

Publication types

MeSH terms