

Interdomain tilt angle determines integrin-dependent function of the ninth and tenth FIII domains of human fibronectin
- PMID: 15485890
- PMCID: PMC1626575
- DOI: 10.1074/jbc.M406976200
Interdomain tilt angle determines integrin-dependent function of the ninth and tenth FIII domains of human fibronectin
Abstract
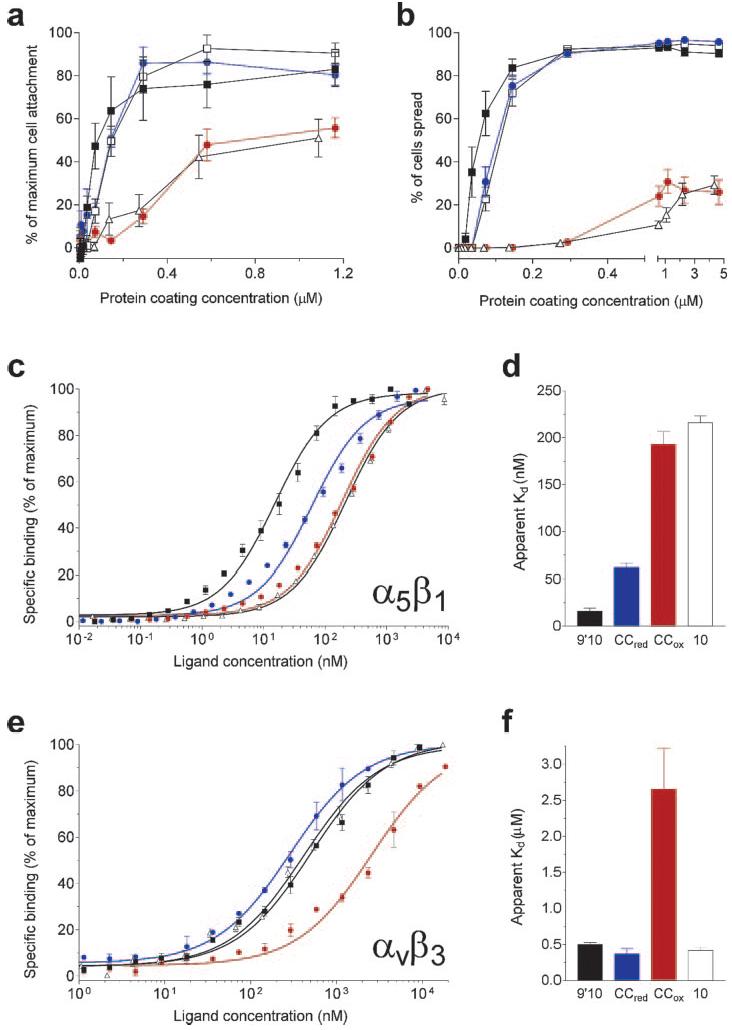
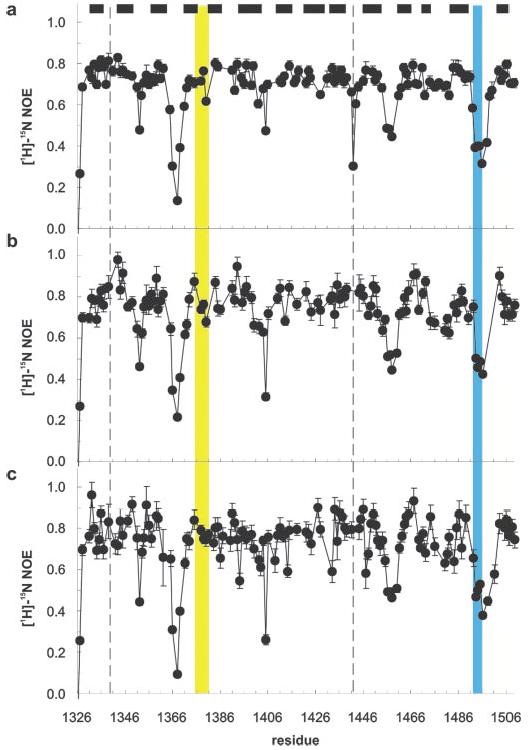
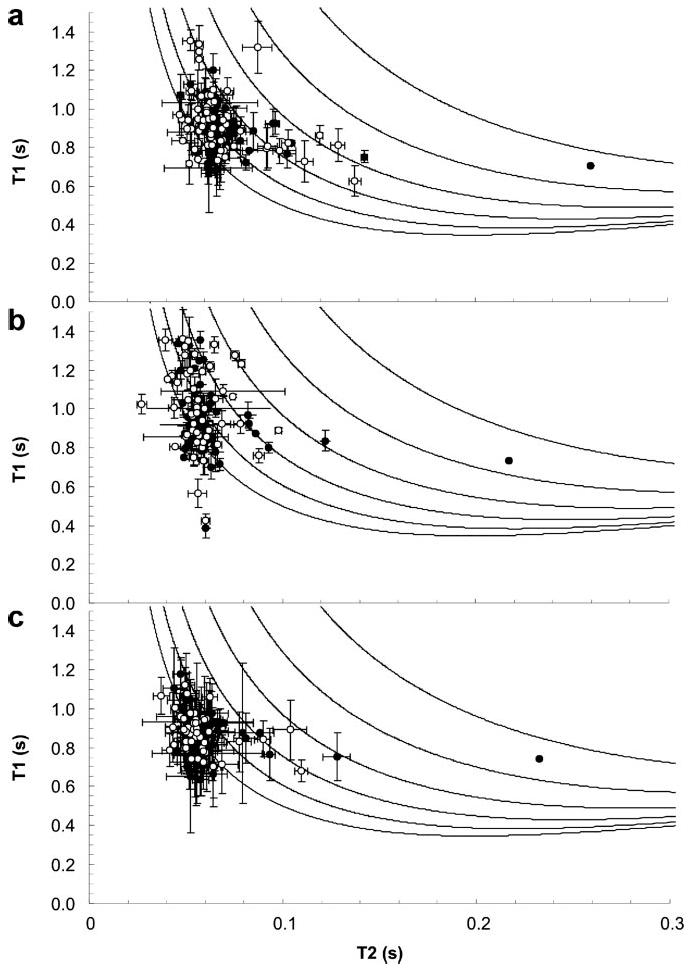
Integrins are an important family of signaling receptors that mediate diverse cellular processes. The binding of the abundant extracellular matrix ligand fibronectin to integrins alpha(5)beta(1) and alpha(v)beta(3) is known to depend upon the Arg-Gly-Asp (RGD) motif on the tenth fibronectin FIII domain. The adjacent ninth FIII domain provides a synergistic effect on RGD-mediated integrin alpha(5)beta(1) binding and downstream function. The precise molecular basis of this synergy remains elusive. Here we have dissected further the function of FIII9 in integrin binding by analyzing the biological activity of the FIII9-10 interdomain interface variants and by determining their structural and dynamic properties in solution. We demonstrate that the contribution of FIII9 to both alpha(5)beta(1) and alpha(v)beta(3) binding and downstream function critically depends upon the interdomain tilt between the FIII9 and FIII10 domains. Our data suggest that modulation of integrin binding by FIII9 may arise in part from its steric properties that determine accessibility of the RGD motif. These findings have wider implications for mechanisms of integrin-ligand binding in the physiological context.
Figures


Similar articles
-
The eighth FIII domain of human fibronectin promotes integrin alpha5beta1 binding via stabilization of the ninth FIII domain.J Biol Chem. 2001 Oct 19;276(42):38885-92. doi: 10.1074/jbc.M105868200. Epub 2001 Aug 10. J Biol Chem. 2001. PMID: 11500513
-
Structural requirements for biological activity of the ninth and tenth FIII domains of human fibronectin.J Biol Chem. 1997 Mar 7;272(10):6159-66. doi: 10.1074/jbc.272.10.6159. J Biol Chem. 1997. PMID: 9045628 Free PMC article.
-
Synergistic activity of the ninth and tenth FIII domains of human fibronectin depends upon structural stability.J Biol Chem. 2003 Jan 3;278(1):491-7. doi: 10.1074/jbc.M209992200. Epub 2002 Oct 9. J Biol Chem. 2003. PMID: 12376529 Free PMC article.
-
Structural basis for ligand recognition by RGD (Arg-Gly-Asp)-dependent integrins.Biochem Soc Trans. 2004 Jun;32(Pt3):403-6. doi: 10.1042/BST0320403. Biochem Soc Trans. 2004. PMID: 15157147 Review.
-
Integrins in cell adhesion and signaling.Hum Cell. 1996 Sep;9(3):181-6. Hum Cell. 1996. PMID: 9183647 Review.
Cited by
-
A Matricryptic Conformation of the Integrin-Binding Domain of Fibronectin Regulates Platelet-Derived Growth Factor-Induced Intracellular Calcium Release.Cells. 2019 Oct 30;8(11):1351. doi: 10.3390/cells8111351. Cells. 2019. PMID: 31671632 Free PMC article.
-
Utilizing Fibronectin Integrin-Binding Specificity to Control Cellular Responses.Adv Wound Care (New Rochelle). 2015 Aug 1;4(8):501-511. doi: 10.1089/wound.2014.0621. Adv Wound Care (New Rochelle). 2015. PMID: 26244106 Free PMC article. Review.
-
Dynamic structure of plasma fibronectin.Crit Rev Biochem Mol Biol. 2015 Jul-Aug;51(4):213-27. doi: 10.1080/10409238.2016.1184224. Epub 2016 May 17. Crit Rev Biochem Mol Biol. 2015. PMID: 27185500 Free PMC article. Review.
-
Interdomain association in fibronectin: insight into cryptic sites and fibrillogenesis.EMBO J. 2007 May 16;26(10):2575-83. doi: 10.1038/sj.emboj.7601694. Epub 2007 Apr 26. EMBO J. 2007. PMID: 17464288 Free PMC article.
-
Motogenic sites in human fibronectin are masked by long range interactions.J Biol Chem. 2009 Jun 5;284(23):15668-75. doi: 10.1074/jbc.M109.003673. Epub 2009 Apr 14. J Biol Chem. 2009. PMID: 19366708 Free PMC article.
References
Publication types
MeSH terms
Substances
Grants and funding
LinkOut - more resources
Full Text Sources
Other Literature Sources
