Comparative Study
. 2004 Aug;59(2):204-217.
doi: 10.1007/s00239-004-2614-y.

Diversity of guanylate cyclase-activating proteins (GCAPs) in teleost fish: characterization of three novel GCAPs (GCAP4, GCAP5, GCAP7) from zebrafish (Danio rerio) and prediction of eight GCAPs (GCAP1-8) in pufferfish (Fugu rubripes)

Affiliations
Comparative Study

Diversity of guanylate cyclase-activating proteins (GCAPs) in teleost fish: characterization of three novel GCAPs (GCAP4, GCAP5, GCAP7) from zebrafish (Danio rerio) and prediction of eight GCAPs (GCAP1-8) in pufferfish (Fugu rubripes)

Yoshikazu Imanishi et al. J Mol Evol. 2004 Aug.

Abstract

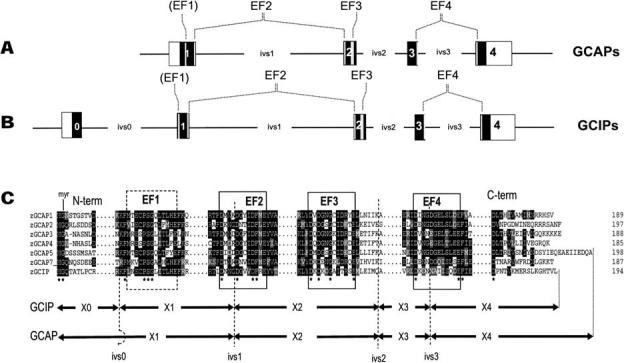
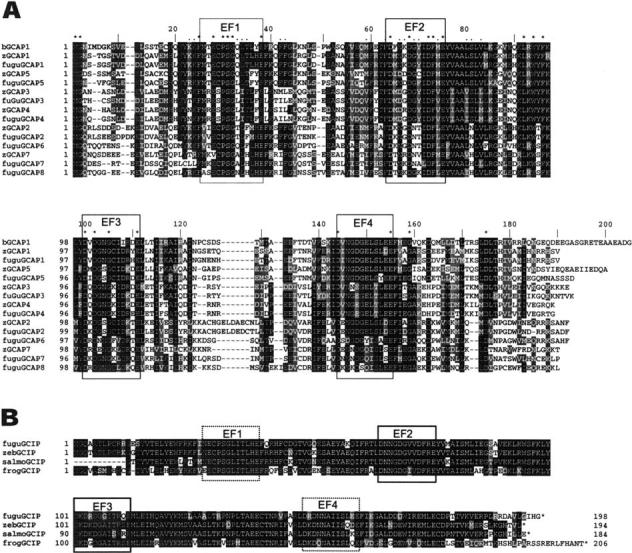
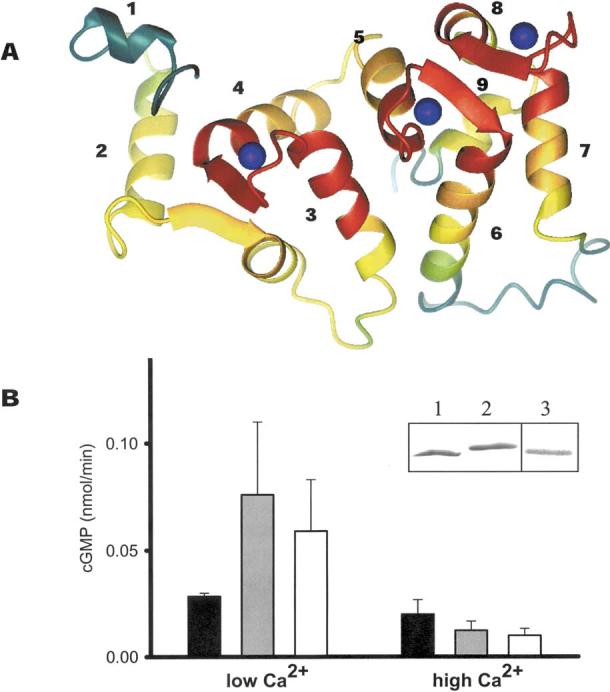
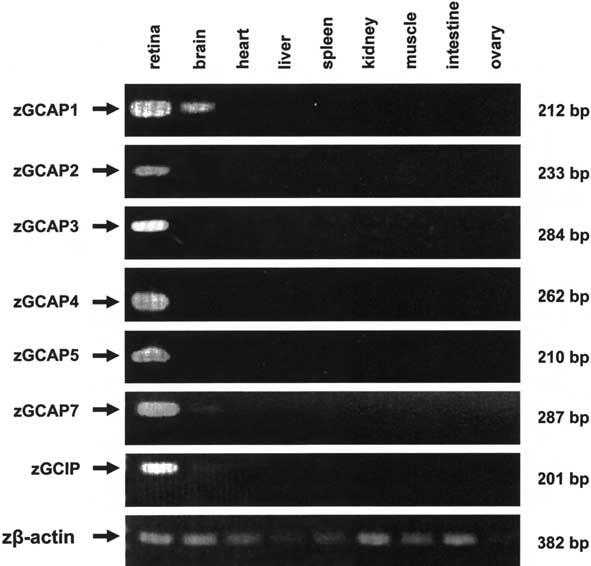
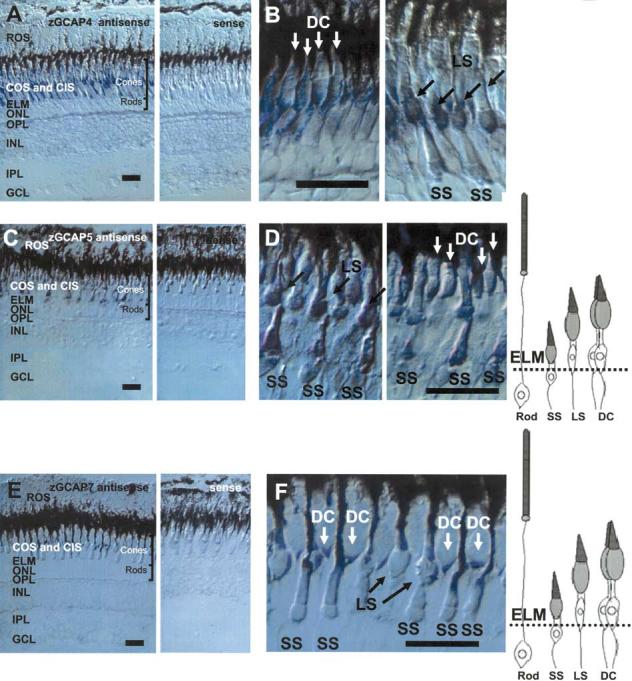
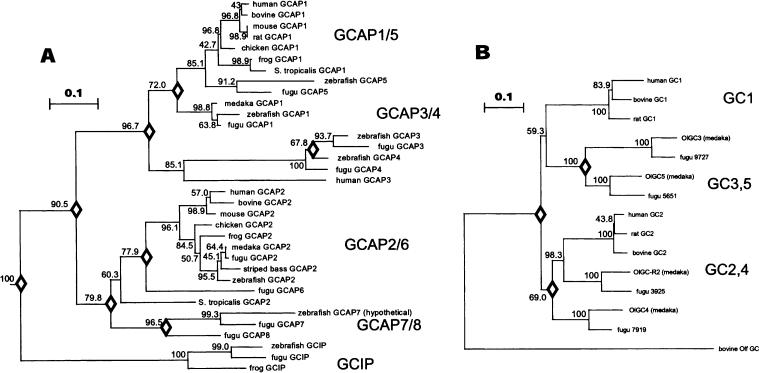
The guanylate cyclase-activating proteins (GCAPs) are Ca(2+)-binding proteins of the calmodulin (CaM) gene superfamily that function in the regulation of photoreceptor guanylate cyclases (GCs). In the mammalian retina, two GCAPs (GCAP 1-2) and two transmembrane GCs have been identified as part of a complex regulatory system responsive to fluctuating levels of free Ca(2+). A third GCAP, GCAP3, is expressed in human and zebrafish (Danio rerio) retinas, and a guanylate cyclase-inhibitory protein (GCIP) has been shown to be present in frog cones. To explore the diversity of GCAPs in more detail, we searched the pufferfish (Fugu rubripes) and zebrafish (Danio rerio) genomes for GCAP-related gene sequences (fuGCAPs and zGCAPs, respectively) and found that at least five additional GCAPs (GCAP4-8) are predicted to be present in these species. We identified genomic contigs encoding fuGCAPl-8, fuGCIP, zGCAPl-5, zGCAP7 and zGCIP. We describe cloning, expression and localization of three novel GCAPs present in the zebrafish retina (zGCAP4, zGCAP5, and zGCAP7). The results show that recombinant zGCAP4 stimulated bovine rod outer segment GC in a Ca(2+)-dependent manner. RT-PCR with zGCAP specific primers showed specific expression of zGCAPs and zGCIP in the retina, while zGCAPl mRNA is also present in the brain. In situ hybridization with anti-sense zGCAP4, zGCAP5 and zGCAP7 RNA showed exclusive expression in zebrafish cone photoreceptors. The presence of at least eight GCAP genes suggests an unexpected diversity within this subfamily of Ca(2+)-binding proteins in the teleost retina, and suggests additional functions for GCAPs apart from stimulation of GC. Based on genome searches and EST analyses, the mouse and human genomes do not harbor GCAP4-8 or GCIP genes.


Figures

Fig. 1.
Fig. 1.
GCAP and GCIP genes. A, B Graphical depictions of GCAP and GCIP gene structures. Black boxes represent coding exons; white boxes, untranslated regions; and lines, introns (ivs0-3). Positions of introns (ivs1-3) are identical in GCAPs and GCIPs. The GCIP gene has acquired an additional intron (ivs0) in the N-terminal region, upstream of EF1. The locations of EF hands are indicated by gray lines. C Partial amino acid sequences and positions of exon/intron junctions of zGCAP and zGCIP genes. Intron positions in the amino acid sequences are indicated by dashed lines. The EF2 and EF4 Ca2+-binding loops are interrupted by introns, while EF1 and EF3 are contiguous. The EF loop sequences containing 12 amino acids, as well as flanking hydrophobic residues, are highly conserved among all GCAPs. The C-terminal regions are among the most divergent.
Fig. 2.
Fig. 2.
Sequence alignments. A Amino acid sequence alignment of Danio rerio and Fugu rubipes GCAPs, compared with bovine GCAP1 (bGCAP1; top). The three functional EF hand motifs (EF2-4) representing high-affinity Ca2+-binding sites are boxed. The nonfunctional EF1 in the N-terminal region is boxed by dashed line. Residues invariant in all GCAPs sequenced to date are marked by asterisks above the sequence; residues identified as subclass-specific are marked by dots. B Alignment of GCIPs (Fugu rubripes, Danio rerio, and Salmo salar) compared with frog (Rana pipiens) GCIP. The salmon GCIP sequence was assembled from several ESTs deposited in GenBank (see Materials and Methods). Note the much higher conservation of residues throughout the polypeptide. Residues conserved in more than 50% of the sequences shown are printed white on black. Conservative substitutions are on a gray background. The alignments were generated by Clustal W (version 1.82) at http://www.ebi.ac.uk/clustalw/ and shaded with boxshade at http://www.ch.embnet.org/software/BOX_form.html.
Fig. 3.
Fig. 3.
Structure and function of GCAPs. A Model of GCAPs based on the NMR structure of bovine GCAP2 (Ames et al. 1999). The conservation of residues between GCAPs was calculated using the T-Coffee method (Notredame et al. 2000). The polypeptide chain is colored as follows: red, 100-80%; orange, 80-60%; yellow, 60-40%; green, 40-20%; and green-blue, 20-0% similarity. Ca2+ions are shown as blue spheres. The most conserved regions are the Ca2+-binding sites (EF-hand loops). The GC-interacting site could involve helix 2 and the following β-sheet, helices 4, 5, and 7. B Reconstitution of ROS GC activity by recombinant bGCAP1 and zGCAP4. Blackbars correspond to ROS GC basal activity, gray bars correspond to ROS GC activity stimulated by bovine GCAP1, and white bars correspond to ROS GC activity stimulated by zGCAP4. Error bars represent standard deviations for GC activity stimulated by GCAPs. Assays were carried out at 50 nM and 1μM [Ca2+]free with the addition of 3 μM GCAPs and were repeated at least three times. Inset: SDS-PAGE (lanes 1 and lane 2) and immunoblotting (lane 3) of GCAP4. Lane 1 represents GCAP4 in the presence of 1 mM Ca2+; lane 2 represents GCAP4 in the presence of 1 mM EGTA.
Fig. 4.
Fig. 4.
Tissue distribution of zGCAP1-7 and GCIP. Specific primers were used to amplify diagnostic cDNA fragments from different tissues by RT/PCR and the products were analyzed by agarose gel electrophoresis. Zβ-Actin primers were used to amplify control fragments from all tissues. Arrows indicate the positions of amplified PCR products; sizes in nucleotides are given at the right. Note amplification of GCAP1, and, to a lesser extent, of GCAP7 and GCIP, in brain.
Fig. 5.
Fig. 5.
Expression of zGCAP4, zGCAP5, and zGCAP7 in the zebrafish retina by in situ hybridization. A In situ hybridization of GCAP4 transcripts using antisense (left) and sense (right) RNA. The strongest signals are in the cone inner segments. No signal is observed in rod myoid or cell bodies. B Localization of GCAP4 mRNA with a higher magnification. Signals are observed in short single cones (SS), long single cones (LS), and double cones (DC). C In situ hybridization of GCAP5 transcripts using antisense (left) and sense (right) RNA. The strong signal is in the cone inner segment. No signal is observed in rod myoid or cell bodies. D Localization of GCAP5 mRNA with a higher magnification. E In situ hybridization of GCAP7 transcripts using antisense (left) and sense (right) RNA. The signal is observed in a subpopulation of cone inner segments. No signal is observed in rod myoid or cell bodies. F Localization of GCAP7 mRNA with a higher magnification. Signals are strong in double cones (DC). Diagrams of zebrafish photoreceptors (modified from Imanishi et al. 2002) are shown at the right. ROS, rod photoreceptor outer segments; COS, cone photoreceptor outer segments; ELM, external limiting membrane; ONL, outer nuclear layer; OPL, outer plexiform layer; INL, inner nuclear layer; IPL, inner plexiform layer; GCL, ganglion cell layer. Bar = 20 μm.
Fig. 6.
Fig. 6.
Phylogenetic analysis of GCAPs and GCs. A A phylogenetic tree calculated from the amino acid sequences of GCAPs. Numbers at the nodes indicate the clustering percentage obtained from 1000 bootstrap resamplings. Bar indicates 10% replacement of an amino acid per site (k = 0.1; see Materials and Methods). The diamonds located at the nodes indicate the estimated gene duplication events. Sequence data used in the present analyses were taken from the GenBank, EMBL, SWISS-PROT, and NCBI databases, except for mouse GCAP2. The accession numbers for the amino acid sequences are as follows: bGCAP1 (Bos taurus), AAB31698; hGCAP1 (Homo sapiens), P_00040; mGCAP1 (Mus musculus), NP_03221; accession rGCAP1, composite sequence of two overlapping ESTs (BF543297 and AI579371), 27681847; cGCAP1 (Gallus gallus), P79880; fuGCAP1 (Rana pipiens) O73761; zGCAP1, AAK95947; fuGCAP1 (Takifugu rubripes), CAD12779; siluGCAP1 (Silurana tropicalis), translated from EST AL874865 (unpublished); oryGCAP1 (Oryzias latipes), BAB83093; bGCAP2, translated from L43001; hGCAP2, 8928106; mGCAP2 (taken from Howes et al. 1998); sbGCAP2 (striped bass; Morone saxatilis), K. Zhang and W. Baehr, unpublished; cGCAP2 (Gallus gallus), P79881; fuGCAP2 (Rang pipiens), O73762; siluGCAP2 (Silurana tropicalis), translated from EST AL797721; oryGCAP2 (Oryzias latipes), BAB83094; fuGCAP2, CAD12780; zGCAP2 (Danio rerio), AAK95948; hGCAP3, (Homo sapiens), AAD19944; zGCAP3 (Danio rerio), AAK95949; zGCAP4, 5, 7, (to be submitted to GenBank); fuGCIP (Rana pipiens), O73763. B A phylogenetic tree calculated from the amino acid sequences of photoreceptor GCs. Conserved amino acid sequences including transmembrane domain and intracellular domains are used for calculation. Bar indicates 10% replacement of an amino acid per site (k = 0.1; see Materials and Methods). The accession numbers of the amino acid sequences are as follows: bovine GC1, AAB86385; human GC1, Q02846; rat GC1, P51840; bovine GC2, O02740: human GC2, P51841; rat GC2, P51842; bovine GColf, AAC31208. For teleost olGC accession numbers, see Materials and Methods.

References

    1. Altschul SF, Gish W, Miller W, Myers EW, Lipman DJ. Basic local alignment search tool. J Mol Biol. 1990;215:403–410. - PubMed
    1. Ames JB, Dizhoor AM, Ikura M, Palczewski K, Stryer L. Three-dimensional structure of guanylyl cyclase activating protein-2, a calcium-sensitive modulator of photoreceptor guanylyl cyclases. J Biol Chem. 1999;274:19329–19337. - PubMed
    1. Aparicio S, Chapman J, Stupka E, Putnam N, Chia JM, Dehal P, Christoffels A, Rash S, Hoon S, Smit A, Gelpke MD, Roach J, Oh T, Ho IY, Wong M, Detter C, Verhoef F, Predki P, Tay A, Lucas S, Richardson P, Smith SF, Clark MS, Edwards YJ, Doggett N, Zharkikh A, Tavtigian SV, Pruss D, Barnstead M, Evans C, Baden H, Powell J, Glusman G, Rowen L, Hood L, Tan YH, Elgar G, Hawkins T, Venkatesh B, Rokhsar D, Brenner S. Whole-genome shotgun assembly and analysis of the genome of Fugu rubripes. Science. 2002;297:1301–1310. - PubMed
    1. Applebury ML, Antoch MP, Baxter LC, Chun LL, Falk JD, Farhangfar F, Kage K, Krzystolik MG, Lyass LA, Robbins JT. The murine cone photoreceptor: A single cone type expresses both S and M opsins with retinal spatial patterning. Neuron. 2000;27:513–523. - PubMed
    1. Asaoka Y, Mano H, Kojima D, Fukada Y. Pineal expression-promoting element (PIPE), a cis-acting element, directs pineal-specific gene expression in zebrafish. Proc Natl Acad Sci USA. 2002;99:15456–15461. - PMC - PubMed

Publication types

MeSH terms