Comparative Study
. 2004 Oct 15:5:151.
doi: 10.1186/1471-2105-5-151.

Caryoscope: an Open Source Java application for viewing microarray data in a genomic context

Affiliations
Comparative Study

Caryoscope: an Open Source Java application for viewing microarray data in a genomic context

Ihab A B Awad et al. BMC Bioinformatics. .

Abstract

Background: Microarray-based comparative genome hybridization experiments generate data that can be mapped onto the genome. These data are interpreted more easily when represented graphically in a genomic context.

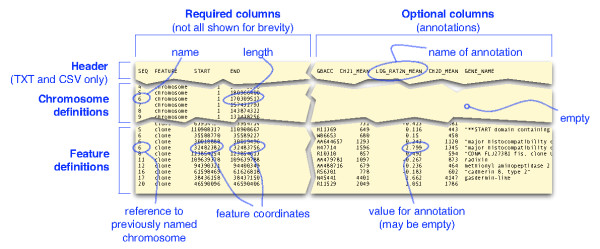
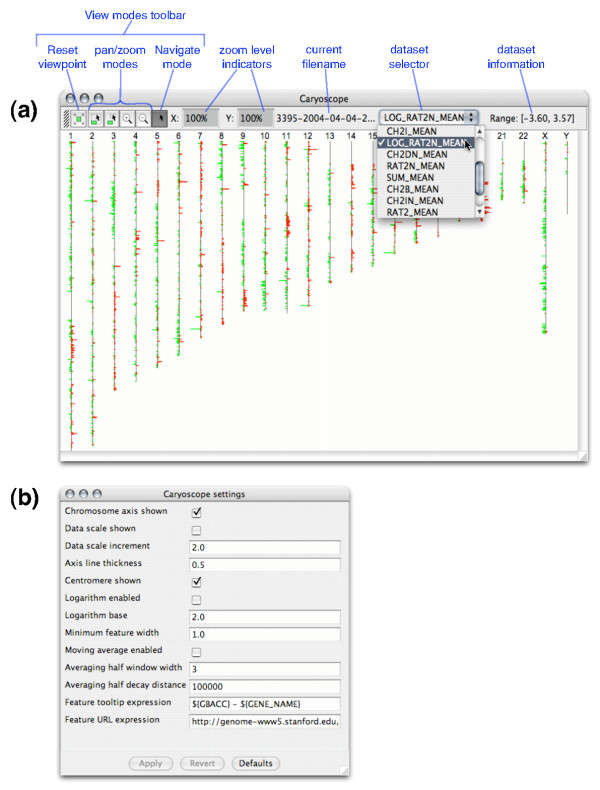
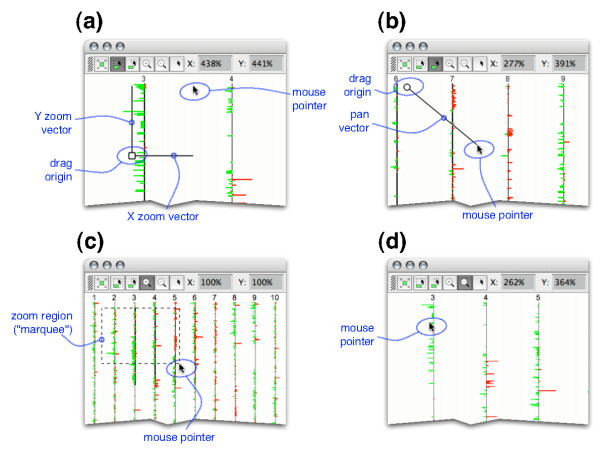
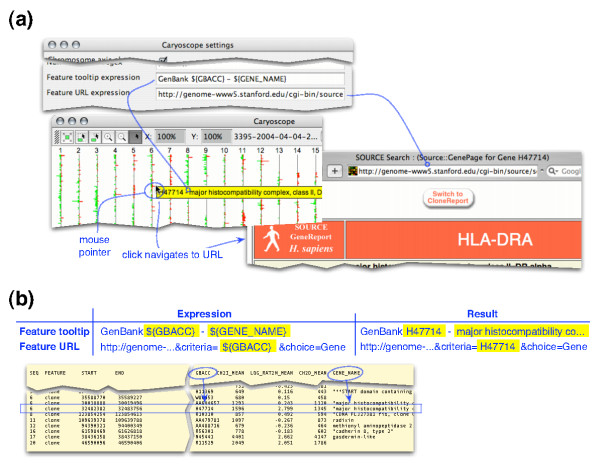
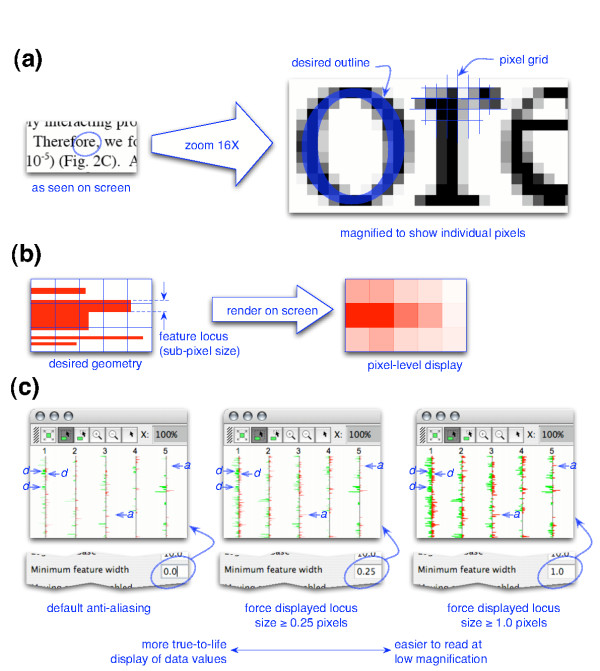
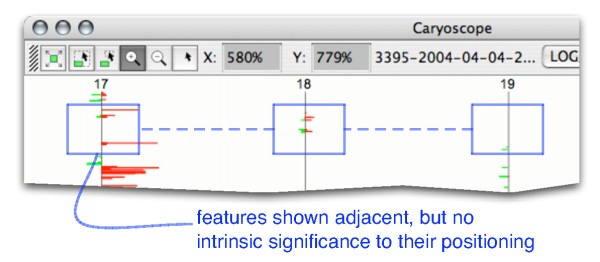
Results: We have developed Caryoscope, which is an open source Java application for visualizing microarray data from array comparative genome hybridization experiments in a genomic context. Caryoscope can read General Feature Format files (GFF files), as well as comma- and tab-delimited files, that define the genomic positions of the microarray reporters for which data are obtained. The microarray data can be browsed using an interactive, zoomable interface, which helps users identify regions of chromosomal deletion or amplification. The graphical representation of the data can be exported in a number of graphic formats, including publication-quality formats such as PostScript.

Conclusion: Caryoscope is a useful tool that can aid in the visualization, exploration and interpretation of microarray data in a genomic context.


Figures

Figure 1
Figure 1
The Caryoscope input file format. An illustration of the input file format for Caryoscope. A tab-delimited (TXT) file is shown as an example, but the CSV and GFF formats are similar. Each column of data represents an annotation, with the name of the annotation at the top. Note how, at this level, there is no distinction between expression data and other information: for maximum flexibility, everything is an annotation.
Figure 2
Figure 2
The Caryoscope main window. (a) Caryoscope displays all numerical annotations from the data file as datasets. The datasets are available for viewing via the dataset selector at the top of the Caryoscope window. (The data shown are provided by Jon Pollack, from a breast tumor sample. Note the significant regions of amplification and deletion.) The toolbar at the top allows the user to select a variety of modes for viewing the data. The panning and zooming modes allow the user to navigate the data, while the Reset viewpoint button returns to display all of the data in the current dataset, scaled to the current window size. The Navigate mode enables hyperlinking and tooltips. The zoom level indicators improve the user's situational awareness while viewing the data. (b) The Settings window allows the user to configure the application.
Figure 3
Figure 3
Zooming and panning modes. The zooming and panning modes are selected from the View modes toolbar. (a) In Dynamic zoom mode, the user clicks then drags the mouse; based on the mouse motion, the view zooms continuously with independent zoom speeds in the X and Y directions. (b) In Dynamic pan mode, the user clicks then drags the mouse; the direction and distance of the mouse motion determines the speed and direction of the panning motion through the data. (c) In Zoom in mode, the user selects a region (denoted by a "marquee"). The display is zoomed so that the selected region is fit to the current window. The user may also click anywhere within the current window, which zooms in by a fixed scaling, centered on the click point. (d) In Zoom out mode, the user clicks anywhere, which zooms out by a fixed scaling, centered on the click point.
Figure 4
Figure 4
Navigate mode. (a) In this mode, Caryoscope shows a tooltip (small informational pop-up window) whenever the user moves the mouse over a feature. When the user clicks on the feature, Caryoscope navigates to a URL related to the feature. Both the tooltip text and the URL are generated dynamically from the annotations on the feature under the mouse pointer, via the Feature tooltip expression and Feature URL expression settings. (b) Illustration of how the tooltips and URLs are computed from the Feature tooltip expression and Feature URL expression settings and the annotations in the input file.
Figure 5
Figure 5
Example of anti-aliasing. A demonstration of the effect of anti-aliasing in Caryoscope. (a) Anti-aliased text displayed by Adobe Acrobat 6.0 on an Apple computer running Macintosh OS 10.3.3. Note that the text appears as if drawn by smooth black ink but, upon magnification, it becomes clear that this smoothness is a visual illusion created by careful manipulation of the color of each pixel. (b) The analogous situation in Caryoscope, where the scaled sizes of the feature loci are smaller than one pixel on the display device. In this example, we applied a form of anti-aliasing by prefiltering, where we computed the color of each pixel based on the area of red rectangles it contains. See [20]. (c) Actual displays from Caryoscope showing how the Minimum feature width setting highlights different aspects of the data. The three deletions d on chromosome 1 are clearly distinct at a setting of zero, but are lost in the midst of other artificially expanded features when the setting is increased. On the other hand, the two amplification "spikes" a on chromosomes 3 and 5 are invisible at a setting of zero, but become visible when the setting is increased.
Figure 6
Figure 6
Zooming paradigm. An example of a partially zoomed-in display, which highlights adjacent regions of four chromosomes. The model of continuous 2-dimensional zooming breaks down in this case, since the adjacency of these regions is not biologically relevant.

Similar articles

Cited by

References

    1. Eisen MB, Spellman PT, Brown PO, Botstein D. Cluster analysis and display of genome-wide expression patterns. Proc Natl Acad Sci U S A. 1998;95:14863–14868. doi: 10.1073/pnas.95.25.14863. - DOI - PMC - PubMed
    1. Pollack JR, Perou CM, Alizadeh AA, Eisen MB, Pergamenschikov A, Williams CF, Jeffrey SS, Botstein D, Brown PO. Genome-wide analysis of DNA copy-number changes using cDNA microarrays. Nat Genet. 1999;23:41–46. doi: 10.1038/14385. - DOI - PubMed
    1. Crawley JJ, Furge KA. Identification of frequent cytogenetic aberrations in hepatocellular carcinoma using gene-expression microarray data. Genome Biol. 2002;3:RESEARCH0075. doi: 10.1186/gb-2002-3-12-research0075. - DOI - PMC - PubMed
    1. Hughes TR, Roberts CJ, Dai H, Jones AR, Meyer MR, Slade D, Burchard J, Dow S, Ward TR, Kidd MJ, Friend SH, Marton MJ. Widespread aneuploidy revealed by DNA microarray expression profiling. Nat Genet. 2000;25:333–337. doi: 10.1038/77116. - DOI - PubMed
    1. Pollack JR, Sorlie T, Perou CM, Rees CA, Jeffrey SS, Lonning PE, Tibshirani R, Botstein D, Borresen-Dale AL, Brown PO. Microarray analysis reveals a major direct role of DNA copy number alteration in the transcriptional program of human breast tumors. Proc Natl Acad Sci U S A. 2002;99:12963–12968. doi: 10.1073/pnas.162471999. - DOI - PMC - PubMed

Publication types