

Mechanical properties of single myosin molecules probed with the photonic force microscope
- PMID: 15489300
- PMCID: PMC1305012
- DOI: 10.1529/biophysj.104.047795
Mechanical properties of single myosin molecules probed with the photonic force microscope
Abstract
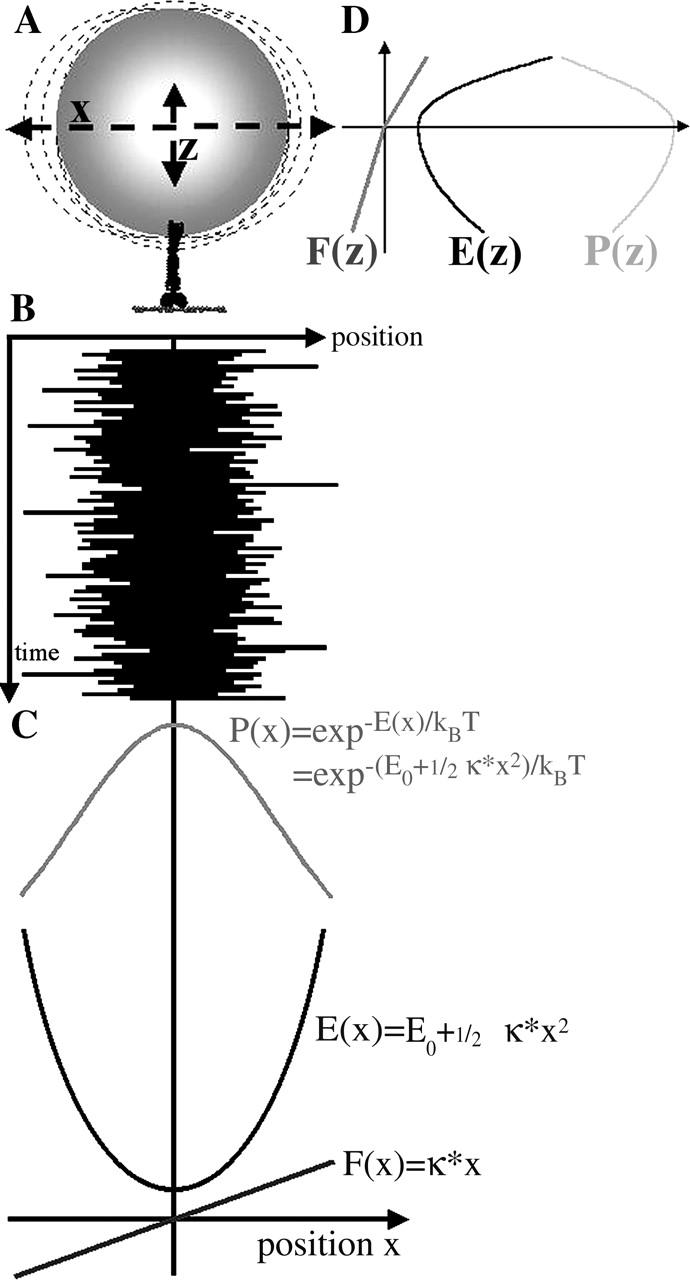
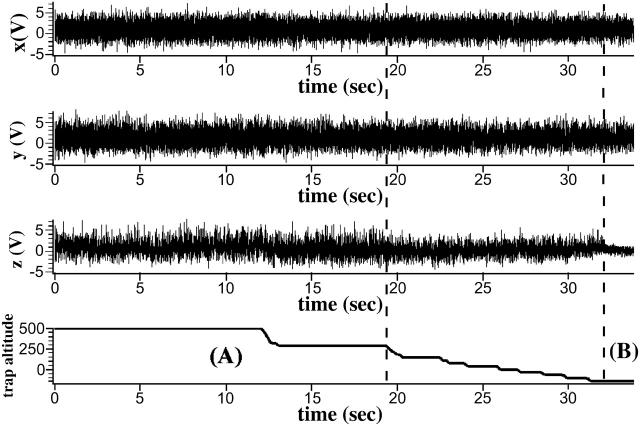
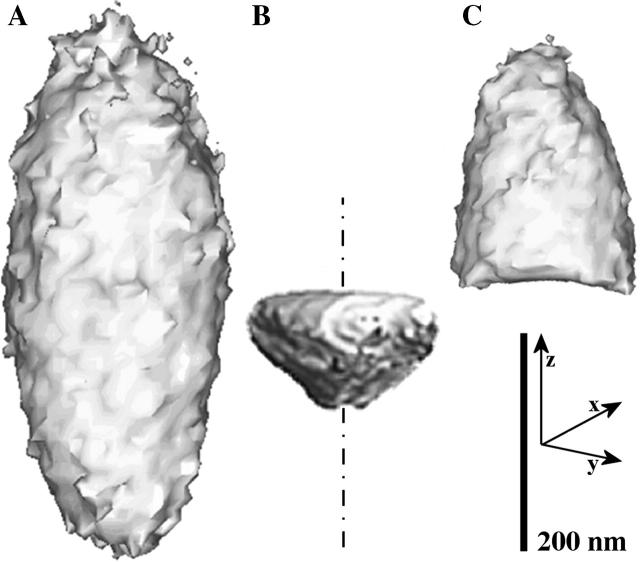
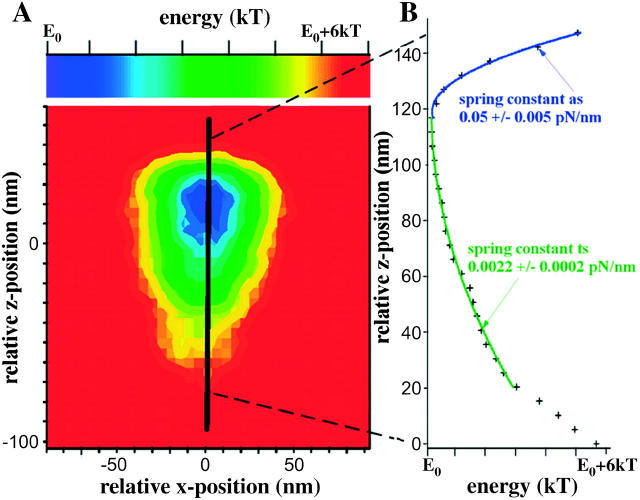
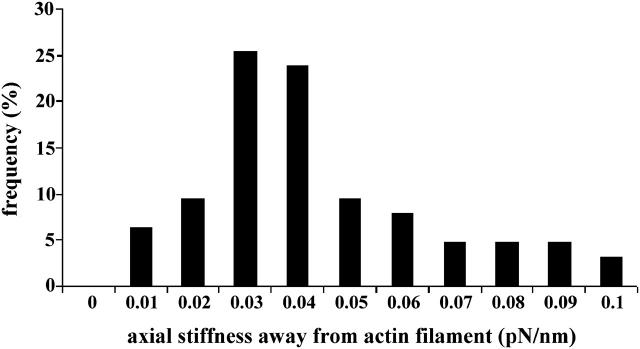
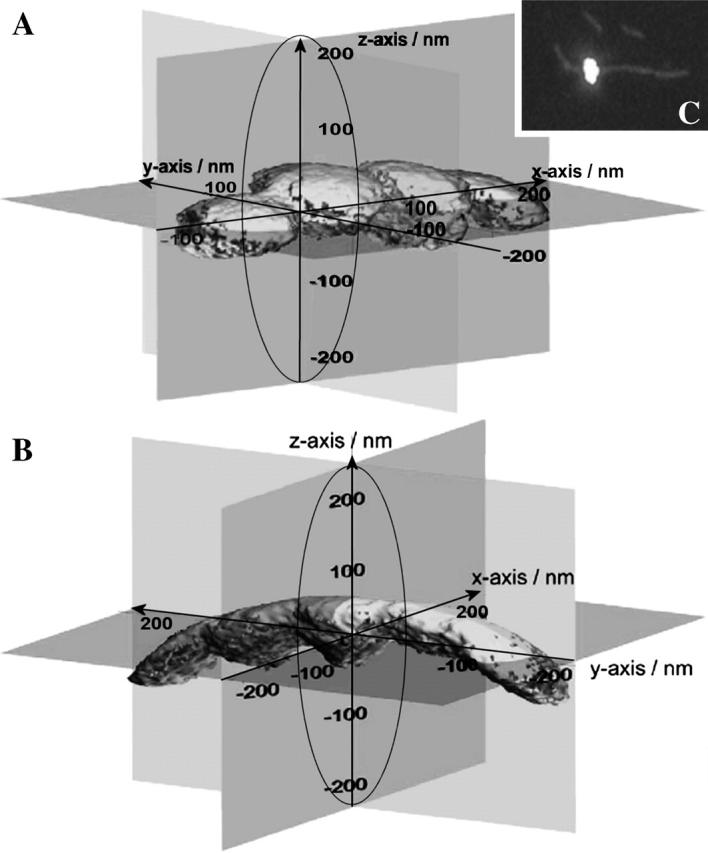
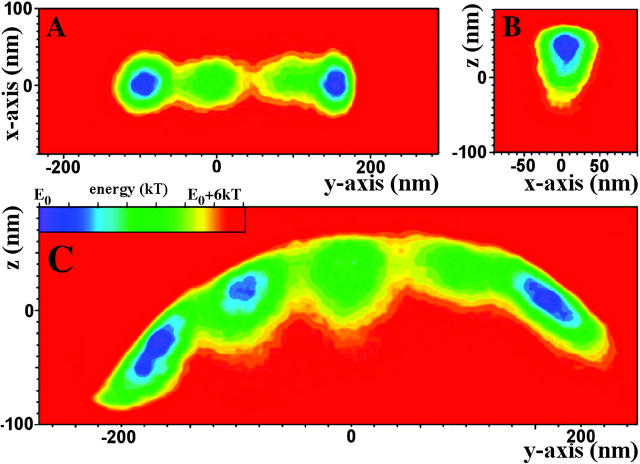
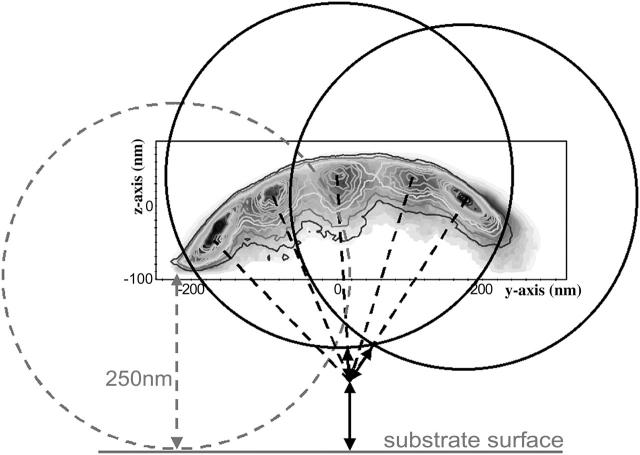
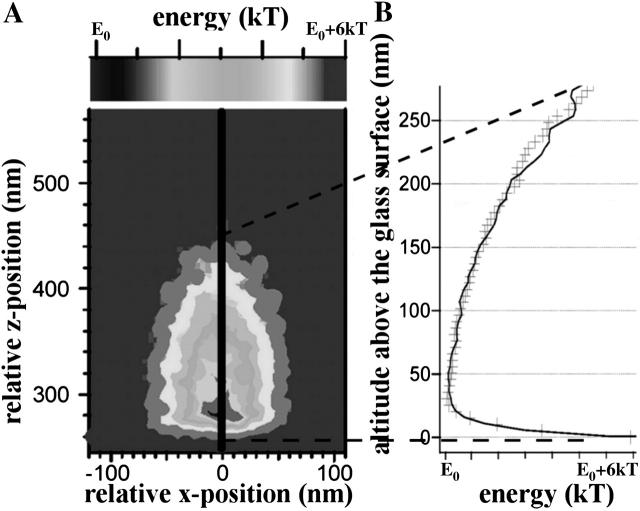
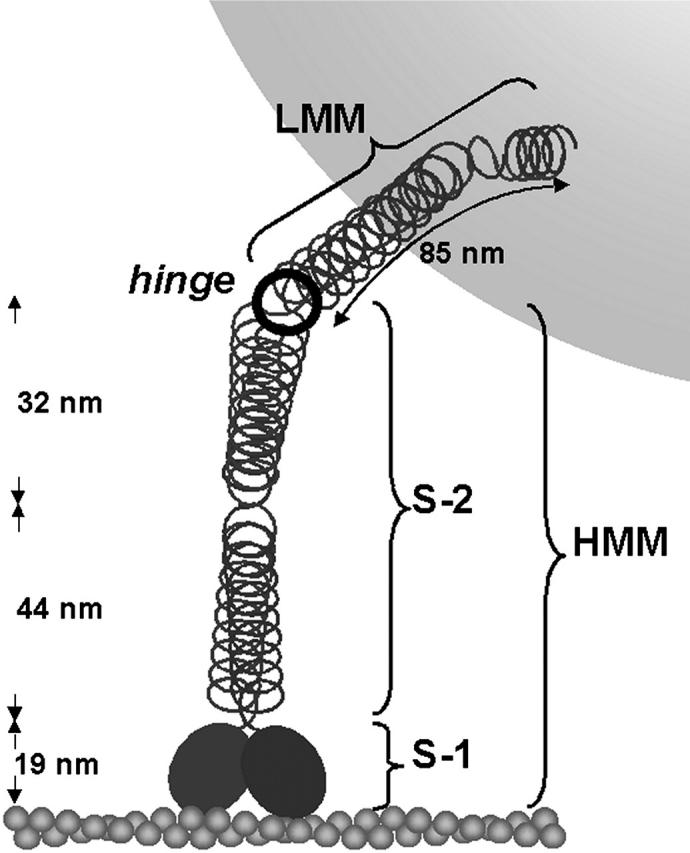
To characterize elastic properties and geometrical parameters of individual, whole myosin molecules during their interaction with actin we sparsely adsorbed myosin molecules to nanometer-sized microspheres. Thermally driven position fluctuations of these microspheres were recorded with the three-dimensional detection scheme of the photonic force microscope. Upon binding of single myosin molecules to immobilized actin filaments in the absence of ATP, these thermally driven position fluctuations of the microspheres change significantly. From three-dimensional position fluctuations stiffness and geometrical information of the tethering molecule can be derived. Axial stiffness was found to be asymmetric, approximately 0.04 pN/nm for extension, approximately 0.004 pN/nm for compression. Observed stiffness of whole myosin molecules is much less than estimated for individual myosin heads in muscle fibers or for single-molecule studies on myosin fragments. The stiffness reported here, however, is identical to stiffness found in other single-molecule studies with full-length myosin suggesting that the source of this low stiffness is located outside the myosin head domain. Analysis of geometrical properties of tethering myosin molecules by Brownian dynamics computer simulations suggests a linker length of approximately 130 nm that is divided by a free hinge located approximately 90 nm above the substrate. This pivot location coincides with myosin's hinge region. We demonstrate the general applicability of thermal fluctuation analysis to determine elastic properties and geometrical factors of individual molecules.
Figures
Similar articles
-
Single-molecule measurement of the stiffness of the rigor myosin head.Biophys J. 2008 Mar 15;94(6):2160-9. doi: 10.1529/biophysj.107.119396. Epub 2007 Dec 7. Biophys J. 2008. PMID: 18065470 Free PMC article.
-
Multiple- and single-molecule analysis of the actomyosin motor by nanometer-piconewton manipulation with a microneedle: unitary steps and forces.Biophys J. 1996 Jan;70(1):383-400. doi: 10.1016/S0006-3495(96)79582-6. Biophys J. 1996. PMID: 8770215 Free PMC article.
-
Structural characterization of the binding of Myosin*ADP*Pi to actin in permeabilized rabbit psoas muscle.Biophys J. 2006 Nov 1;91(9):3370-82. doi: 10.1529/biophysj.106.086918. Epub 2006 Aug 11. Biophys J. 2006. PMID: 16905611 Free PMC article.
-
Induced potential model of muscular contraction mechanism and myosin molecular structure.Adv Biophys. 1999;36:107-58. doi: 10.1016/s0065-227x(99)80006-9. Adv Biophys. 1999. PMID: 10463074 Review.
-
Visualizing myosin's power stroke in muscle contraction.J Cell Sci. 2000 Oct;113 ( Pt 20):3551-62. doi: 10.1242/jcs.113.20.3551. J Cell Sci. 2000. PMID: 11017871 Review.
Cited by
-
New techniques in linear and non-linear laser optics in muscle research.J Muscle Res Cell Motil. 2006;27(5-7):469-79. doi: 10.1007/s10974-006-9084-3. Epub 2006 Aug 24. J Muscle Res Cell Motil. 2006. PMID: 16933024 Review.
-
Single-particle tracking of membrane protein diffusion in a potential: simulation, detection, and application to confined diffusion of CFTR Cl- channels.Biophys J. 2007 Aug 1;93(3):1079-88. doi: 10.1529/biophysj.106.102244. Epub 2007 May 4. Biophys J. 2007. PMID: 17483157 Free PMC article.
-
Interaction of kinesin motors, microtubules, and MAPs.J Muscle Res Cell Motil. 2006;27(2):125-37. doi: 10.1007/s10974-005-9051-4. Epub 2005 Dec 17. J Muscle Res Cell Motil. 2006. PMID: 16362723 Review.
-
Alternative S2 hinge regions of the myosin rod differentially affect muscle function, myofibril dimensions and myosin tail length.J Mol Biol. 2007 Apr 13;367(5):1312-29. doi: 10.1016/j.jmb.2007.01.045. Epub 2007 Jan 23. J Mol Biol. 2007. PMID: 17316684 Free PMC article.
References
-
- Altmann, S. M. 2002. Single molecule mechanics: linking structure and function of proteins; development and application of local probe techniques. PhD thesis. Universität Ulm, Ulm, Germany.
-
- Block, S. M., L. S. Goldstein, and B. J. Schnapp. 1990. Bead movement by single kinesin molecules studied with optical tweezers. Nature. 348:348–352. - PubMed
-
- Dobbie, I., M. Linari, G. Piazzesi, M. Reconditi, N. Koubassova, M. A. Ferenczi, V. Lombardi, and M. Irving. 1998. Elastic bending and active tilting of myosin heads during muscle contraction. Nature. 396:383–387. - PubMed
-
- Elliott, A., and G. Offer. 1978. Shape and flexibility of the myosin molecule. J. Mol. Biol. 123:505–519. - PubMed
-
- Finer, J. T., R. M. Simmons, and J. A. Spudich. 1994. Single myosin molecule mechanics: piconewton forces and nanometre steps. Nature. 368:113–119. - PubMed
Publication types
MeSH terms
Substances
LinkOut - more resources
Full Text Sources
