Measurements of DNA lengths remaining in a viral capsid after osmotically suppressed partial ejection
- PMID: 15489301
- PMCID: PMC1305050
- DOI: 10.1529/biophysj.104.045088
Measurements of DNA lengths remaining in a viral capsid after osmotically suppressed partial ejection
Abstract
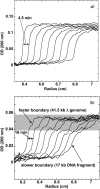
The effect of external osmotic pressure on the extent of DNA ejection from bacteriophage-lambda was recently investigated (Evilevitch et al., 2003). The total length of DNA ejected was measured via the 260-nm absorption by free nucleotides, after opening of the capsids in the presence of varying amounts of polyethylene glycol 8000 and DNase I. As a function of osmolyte concentration, this absorption was shown to decrease progressively, ultimately vanishing completely for a sufficiently high external osmotic pressure. In this work we report the results of both sedimentation and gel analysis of the length of DNA remaining inside the capsids, as a function of osmolyte concentration. It is confirmed in this way that the progressive inhibition of DNA ejection corresponds to partial ejection from all of the capsids.
Figures


Similar articles
-
Effects of condensing agent and nuclease on the extent of ejection from phage lambda.J Phys Chem B. 2006 Nov 9;110(44):22261-5. doi: 10.1021/jp060573j. J Phys Chem B. 2006. PMID: 17078667
-
Osmotic pressure inhibition of DNA ejection from phage.Proc Natl Acad Sci U S A. 2003 Aug 5;100(16):9292-5. doi: 10.1073/pnas.1233721100. Epub 2003 Jul 24. Proc Natl Acad Sci U S A. 2003. PMID: 12881484 Free PMC article.
-
Bacteriophage T5 DNA ejection under pressure.J Mol Biol. 2008 Dec 19;384(3):730-9. doi: 10.1016/j.jmb.2008.09.035. Epub 2008 Sep 21. J Mol Biol. 2008. PMID: 18848568
-
Pressure built by DNA packing inside virions: enough to drive DNA ejection in vitro, largely insufficient for delivery into the bacterial cytoplasm.J Mol Biol. 2007 Nov 23;374(2):346-55. doi: 10.1016/j.jmb.2007.09.045. Epub 2007 Sep 20. J Mol Biol. 2007. PMID: 17942117
-
Effects of salts on internal DNA pressure and mechanical properties of phage capsids.J Mol Biol. 2011 Jan 7;405(1):18-23. doi: 10.1016/j.jmb.2010.10.039. Epub 2010 Oct 28. J Mol Biol. 2011. PMID: 21035458 Review.
Cited by
-
DNA bending-induced phase transition of encapsidated genome in phage λ.Nucleic Acids Res. 2013 Apr;41(8):4518-24. doi: 10.1093/nar/gkt137. Epub 2013 Feb 28. Nucleic Acids Res. 2013. PMID: 23449219 Free PMC article.
-
AT-specific DNA visualization revisits the directionality of bacteriophage λ DNA ejection.Nucleic Acids Res. 2023 Jun 23;51(11):5634-5646. doi: 10.1093/nar/gkad340. Nucleic Acids Res. 2023. PMID: 37158237 Free PMC article.
-
Ejecting phage DNA against cellular turgor pressure.Biophys J. 2014 Oct 21;107(8):1924-1929. doi: 10.1016/j.bpj.2014.09.002. Biophys J. 2014. PMID: 25418173 Free PMC article.
-
DNA ejection from bacteriophage: towards a general behavior for osmotic-suppression experiments.Eur Phys J E Soft Matter. 2007 Sep;24(1):9-18. doi: 10.1140/epje/i2007-10205-5. Epub 2007 Aug 31. Eur Phys J E Soft Matter. 2007. PMID: 17762912
-
Is phage DNA 'injected' into cells--biologists and physicists can agree.Curr Opin Microbiol. 2007 Aug;10(4):401-9. doi: 10.1016/j.mib.2007.04.004. Epub 2007 Aug 21. Curr Opin Microbiol. 2007. PMID: 17714979 Free PMC article. Review.
References
-
- Castelnovo, M., R. K. Bowles, H. Reiss, and W. M. Gelbart. 2003. Force resisting insertion in a colloidal suspension. Eur. Phys. J. E. Soft Matter. 10:191–197. - PubMed
-
- Crothers, D. M., and B. H. Zimm. 1965. Viscosity and sedimentation of the DNA from bacteriophages T2 and T7 and the relation to molecular weight. J. Mol. Biol. 12:525–536. - PubMed
-
- Eisenberg, D., and D. Crothers. 1979. Physical Chemistry with Applications to the Life Sciences. The Benjamin/Cummings Publishing Company, San Francisco, CA.
-
- Evilevitch, A., M. Catselnovo, C. M. Knobler, and W. M. Gelbart. 2004. Measuring the force ejecting DNA from phage. J. Phys. Chem. B. 108:6838–6843.
Publication types
MeSH terms
Substances
LinkOut - more resources
Full Text Sources
Research Materials

