Molecular dynamics simulation of transmembrane polypeptide orientational fluctuations
- PMID: 15489306
- PMCID: PMC1304990
- DOI: 10.1529/biophysj.104.047506
Molecular dynamics simulation of transmembrane polypeptide orientational fluctuations
Abstract
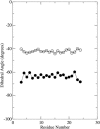
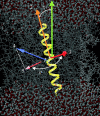
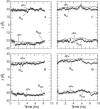
The orientation and motion of a model lysine-terminated transmembrane polypeptide were investigated by molecular dynamics simulation. Recent 2H NMR studies of synthetic polypeptides with deuterated alanine side chains suggest that such transmembrane polypeptides undergo fast, axially symmetric reorientation about the bilayer normal but have a preferred average azimuthal orientation about the helix axis. In this work, interactions that might contribute to this behavior were investigated in a simulated system consisting of 64 molecules of 1-palmitoyl-2-oleoyl-sn-glycero-3-phosphocholine (POPC) and one alpha-helical polypeptide with the sequence acetyl-KK-(LA)11-KK-amide. In one simulation, initiated with the peptide oriented along the bilayer normal, the system was allowed to evolve for 8.5 ns at 1 atm of pressure and a temperature of 55 degrees C. A second simulation was initiated with the peptide orientation chosen to match a set of experimentally observed alanine methyl deuteron quadrupole splittings and allowed to proceed for 10 ns. Simulated alanine methyl group orientations were found to be inequivalent, a result that is consistent with 2H NMR observations of specifically labeled polypeptides in POPC bilayers. Helix tilt varied substantially over the durations of both simulations. In the first simulation, the peptide tended toward an orientation about the helix axis similar to that suggested by experiment. In the second simulation, orientation about the helix axis tended to return to this value after an excursion. These results provide some insight into how interactions at the bilayer surface can constrain reorientation about the helix axis while accommodating large changes in helix tilt.
Figures


Similar articles
-
Orientation and dynamics of synthetic transbilayer polypeptides containing GpATM dimerization motifs.Biophys J. 2011 Feb 2;100(3):656-664. doi: 10.1016/j.bpj.2010.12.3725. Biophys J. 2011. PMID: 21281580 Free PMC article.
-
Epidermal growth factor receptor transmembrane domain: 2H NMR implications for orientation and motion in a bilayer environment.Biochemistry. 1998 Nov 24;37(47):16780-7. doi: 10.1021/bi981520y. Biochemistry. 1998. PMID: 9843449
-
Molecular dynamics of 1-palmitoyl-2-oleoylphosphatidylcholine membranes containing transmembrane alpha-helical peptides with alternating leucine and alanine residues.Biochemistry. 2003 Apr 8;42(13):3939-48. doi: 10.1021/bi020636y. Biochemistry. 2003. PMID: 12667085
-
Organization of model helical peptides in lipid bilayers: insight into the behavior of single-span protein transmembrane domains.Biophys J. 2002 Jul;83(1):345-58. doi: 10.1016/S0006-3495(02)75174-6. Biophys J. 2002. PMID: 12080125 Free PMC article.
-
Long time dynamics of complex systems.Acc Chem Res. 2002 Jun;35(6):396-403. doi: 10.1021/ar010021d. Acc Chem Res. 2002. PMID: 12069624 Review.
Cited by
-
Orientation and motion of tryptophan interfacial anchors in membrane-spanning peptides.Biochemistry. 2007 Jun 26;46(25):7514-24. doi: 10.1021/bi700082v. Epub 2007 May 27. Biochemistry. 2007. PMID: 17530863 Free PMC article.
-
Interpretation of 2H-NMR experiments on the orientation of the transmembrane helix WALP23 by computer simulations.Biophys J. 2010 Sep 8;99(5):1455-64. doi: 10.1016/j.bpj.2010.05.039. Biophys J. 2010. PMID: 20816057 Free PMC article.
-
The dynamic orientation of membrane-bound peptides: bridging simulations and experiments.Biophys J. 2007 Dec 15;93(12):4278-88. doi: 10.1529/biophysj.107.113043. Epub 2007 Aug 24. Biophys J. 2007. PMID: 17720729 Free PMC article.
-
A comparative study on the ability of two implicit solvent lipid models to predict transmembrane helix tilt angles.J Membr Biol. 2011 Jan;239(1-2):57-62. doi: 10.1007/s00232-010-9325-7. Epub 2010 Dec 9. J Membr Biol. 2011. PMID: 21152910 Free PMC article.
-
Molecular dynamics simulations of model trans-membrane peptides in lipid bilayers: a systematic investigation of hydrophobic mismatch.Biophys J. 2006 Apr 1;90(7):2326-43. doi: 10.1529/biophysj.105.073395. Epub 2006 Jan 20. Biophys J. 2006. PMID: 16428278 Free PMC article.
References
-
- Brünger, A. T. 1992. X-plor, Version 3.1: A System for X-Ray Crystallography and NMR. Yale University, New Haven, CT.
-
- Darden, T., D. York, and L. Pedersen. 1993. Particle mesh Ewald: an N·log(N) method for Ewald sums in large systems. J. Chem. Phys. 98:10089–10092.
-
- de Planque, M. R. R., B. B. Bonev, J. A. A. Demmers, D. V. Greathouse, R. E. Koeppe II, F. Separovic, A. Watts, and J. A. Killian. 2003. Interfacial anchor properties of tryptophan residues in transmembrane peptides can dominate over hydrophobic matching effects in peptide-lipid interactions. Biochemistry. 42:5341–5348. - PubMed
Publication types
MeSH terms
Substances
LinkOut - more resources
Full Text Sources
Research Materials
Miscellaneous

