. 2005 Jan;88(1):639-46.
doi: 10.1529/biophysj.104.043398. Epub 2004 Oct 15.

Control of glycolytic oscillations by temperature

Affiliations

Control of glycolytic oscillations by temperature

Thomas Mair et al. Biophys J. 2005 Jan.

Abstract

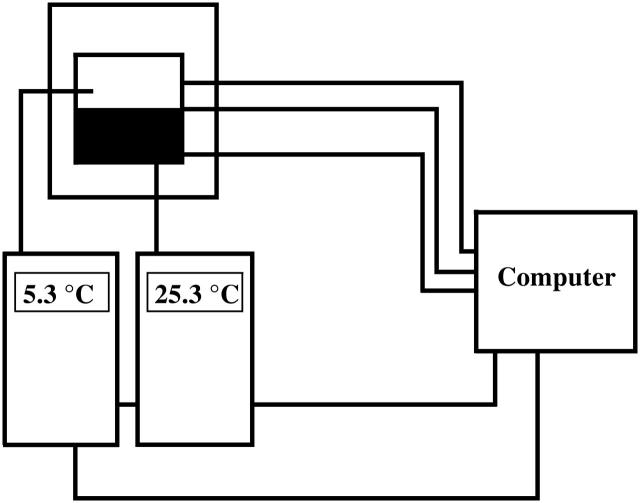
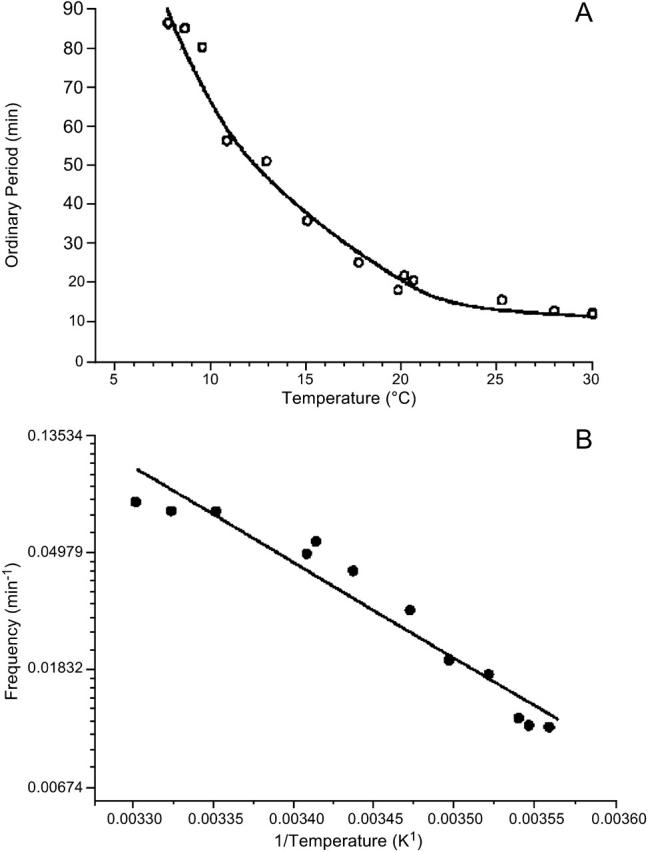
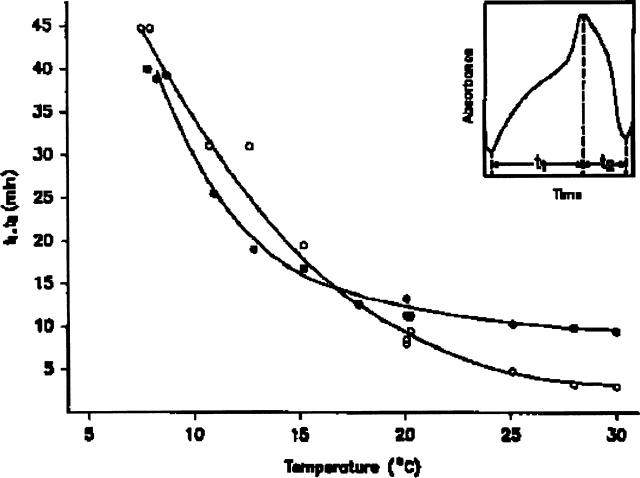
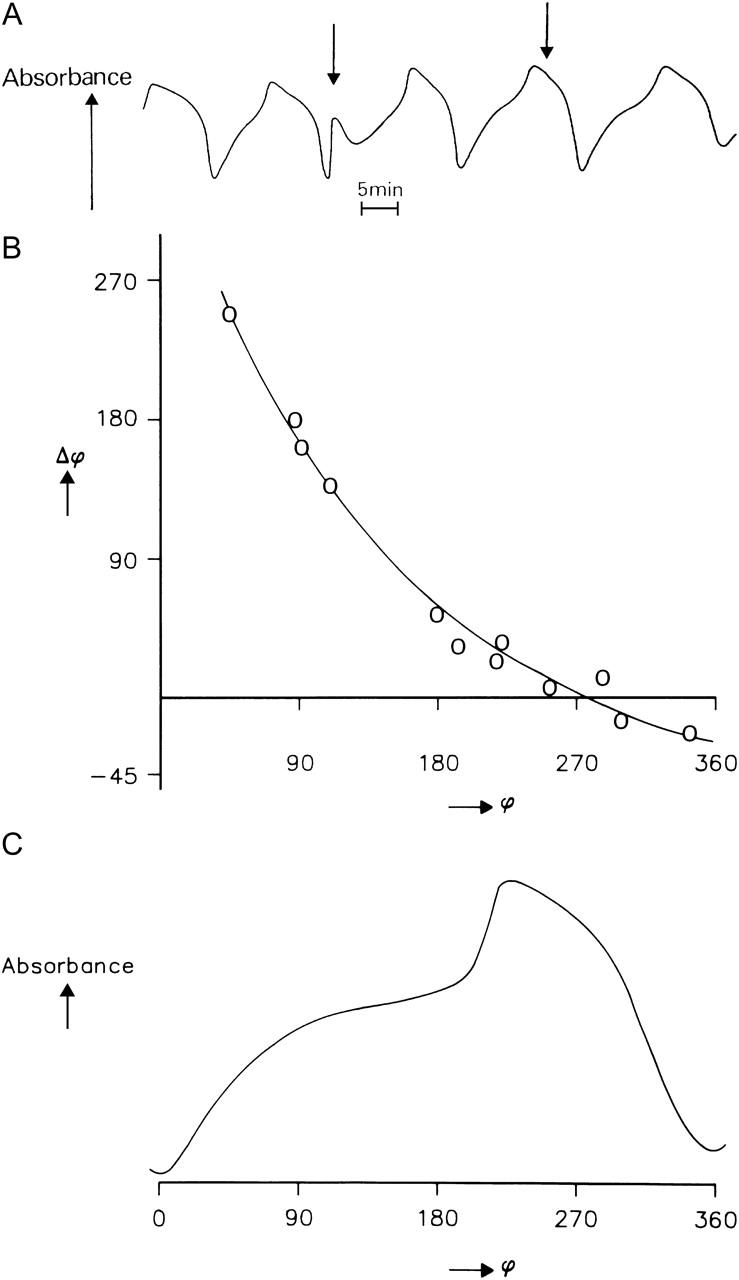
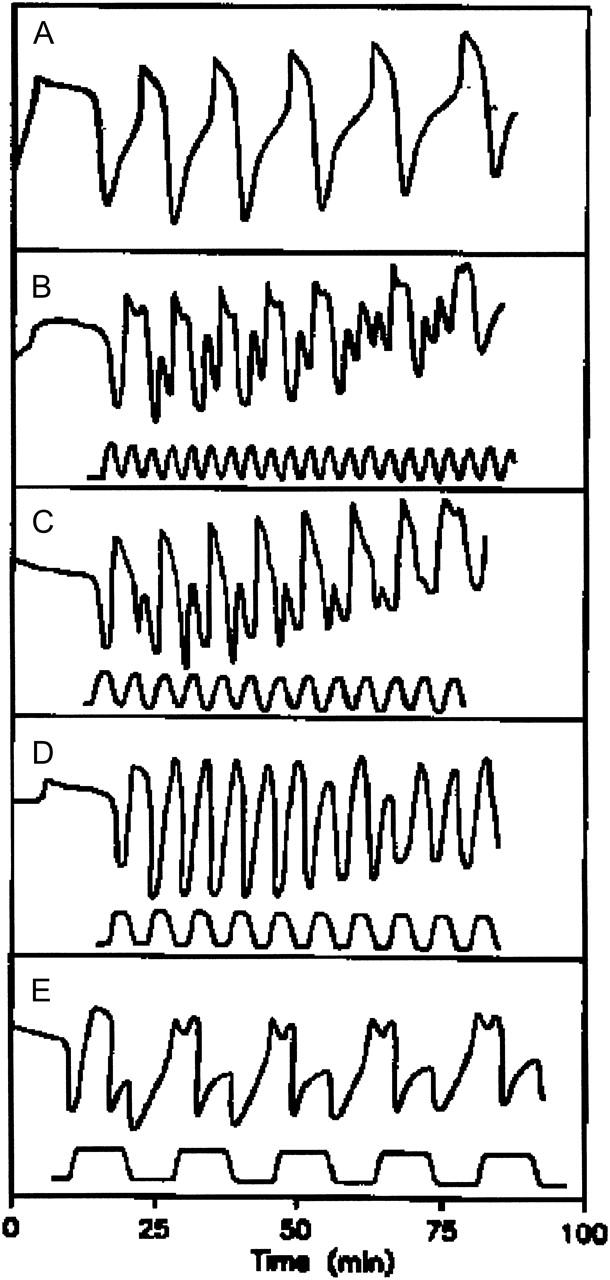
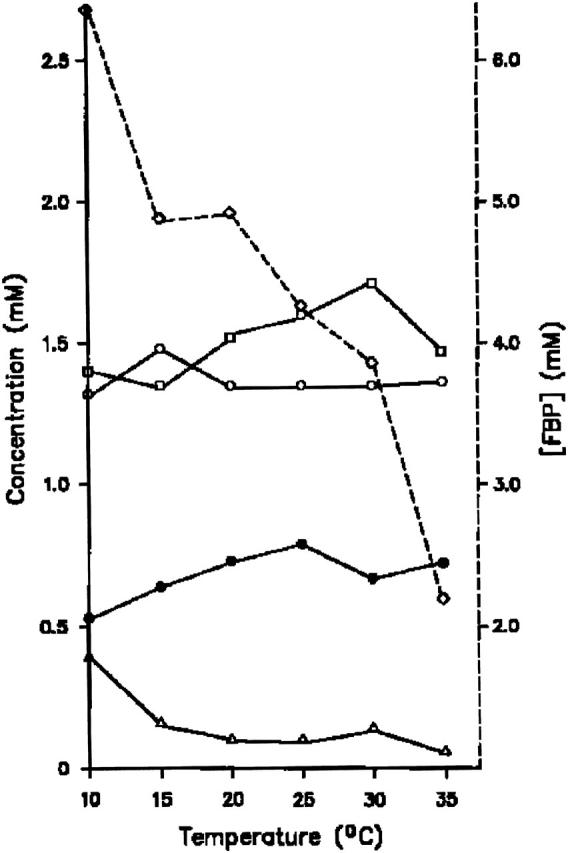
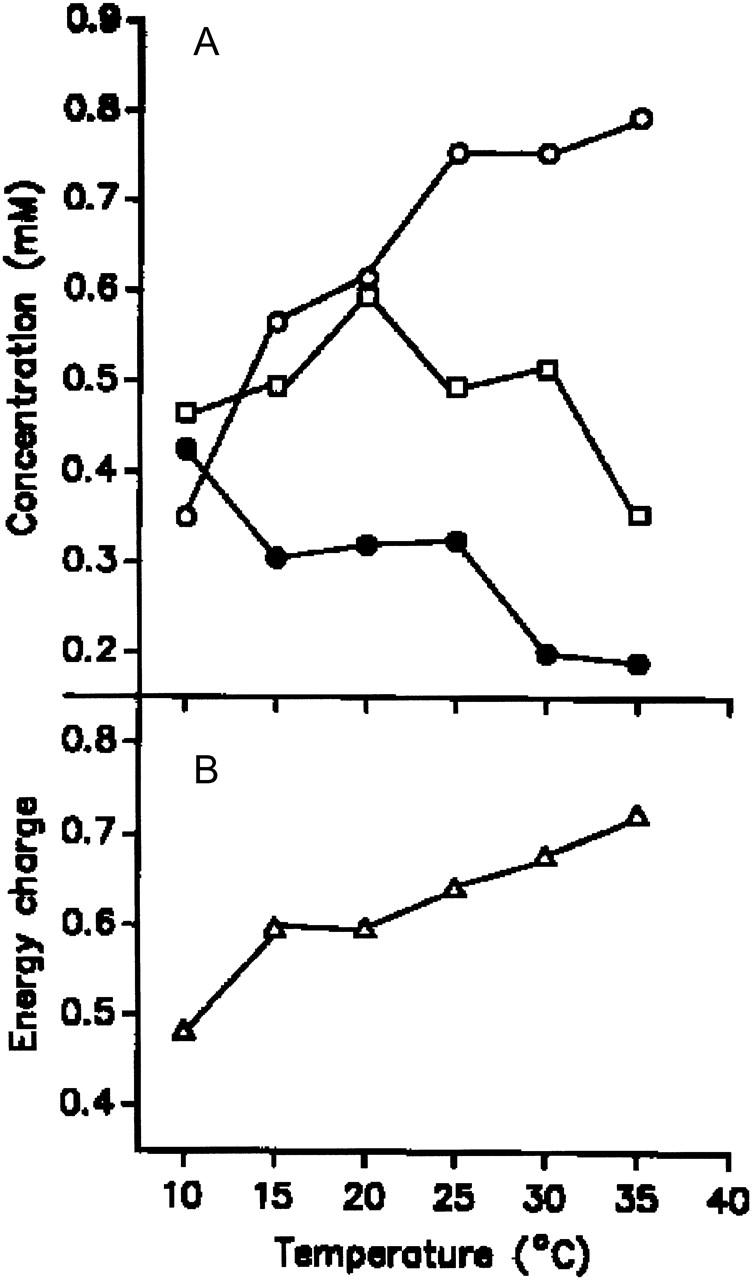
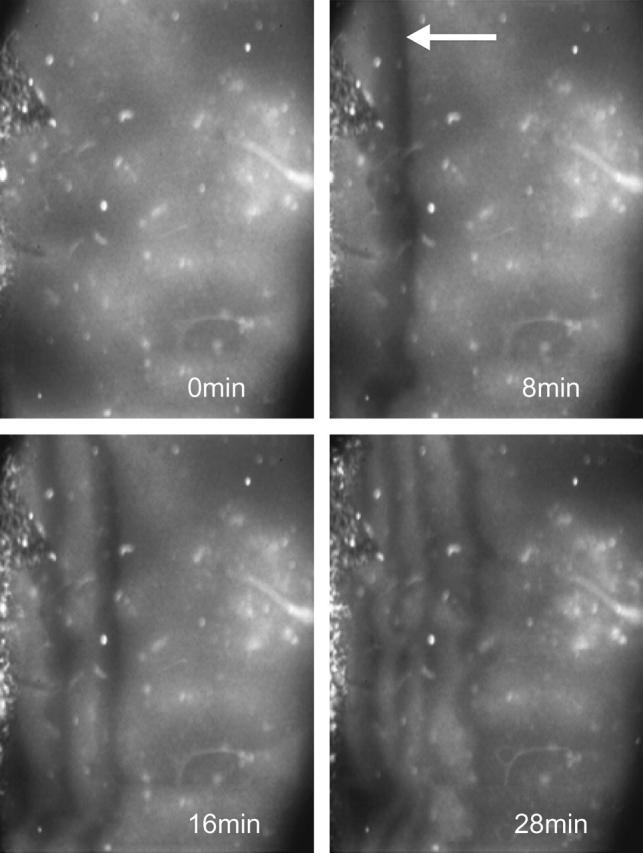
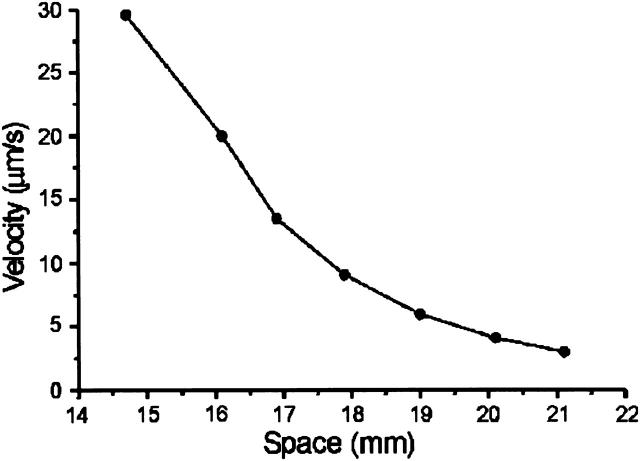
External control of oscillatory glycolysis in yeast extract has been performed by application of either homogeneous temperature oscillations or stationary, spatial temperature gradients. Entrainment of the glycolytic oscillations by the 1/2- and 1/3-harmonic, as well as the fundamental input frequency, could be observed. From the phase response curve to a single temperature pulse, a distinct sensitivity of NADH-oxidizing processes, compared with NAD-reducing processes, is visible. Determination of glycolytic intermediates shows that the feedback-regulated phosphofructokinase as well as the glyceraldehyde-3-phosphate dehydrogenase are the most temperature-sensitive steps of glycolysis. We also find strong concentration changes in ATP and AMP at varying temperatures and, accordingly, in the energy charge. Construction of a feedback loop for spatial control of temperature by means of a Peltier element allowed us to apply a temperature gradient to the yeast extract. With this setup it is possible to initiate traveling waves and to control the wave velocity.


Figures

FIGURE 1
FIGURE 1
Schematic drawing of the experimental setup for spatial temperature control. See text for further explanations.
FIGURE 2
FIGURE 2
Temperature dependence of the period of the glycolytic oscillations of the cell-free cytoplasmic extracts of yeast S. cerevisiae. The oscillation was induced by addition of trehalose and potassium phosphate and monitored by absorption at λ = 340 nm. (A) Plot of the period versus temperature. (B) Arrhenius plot of the data shown in panel A.
FIGURE 3
FIGURE 3
Temperature dependence of the times for the first (t1) and second (t2) phase of the glycolytic oscillation from S. cerevisiae extract. Here, t1 is defined as the time interval from the absorption minimum to the maximum and t2, from the maximum to the minimum (insert). t1 (○); t2 (•).
FIGURE 4
FIGURE 4
Phase response curve derived by application of temperature pulses at a ground temperature of 20°C. (A) Typical example of the effect of a temperature pulse (ΔT = 20°C) on the oscillation. The arrows show the time when the temperature pulse was applied. The ground temperature was 20°C. (B) Phase advance (+Δϕ) and phase delay (−Δϕ) at different phases (ϕ) of the glycolytic oscillations. (C) Attribution of the different phases ϕ to a glycolytic cycle.
FIGURE 5
FIGURE 5
The entrainment pattern of the glycolytic oscillations under periodic temperature variation. The unperturbed, autonomous oscillations, as measured by the NADH absorbance, are shown in panel A. In panels BE the top trace corresponds to the NADH oscillation and the bottom trace to the temperature cycle. The amplitude of the temperature cycle is 7.5 ± 0.5°C.
FIGURE 6
FIGURE 6
The temperature dependence of the average concentrations of: FBP (⋄), G6P (○), F6P (•), GAP (▵), and DAP (□) during the oscillations.
FIGURE 7
FIGURE 7
Temperature dependence of energy charge. (A) Average concentration of ATP (○), ADP (□), and AMP •). (B) Energy charge calculated from the data shown in panel A.
FIGURE 8
FIGURE 8
Induction of traveling NADH waves in a gel-fixed yeast extract from S. carlsbergensis. A temperature gradient was applied (see Methods) and the spatial NADH distribution monitored with a camera. The left side of the gel had a temperature of 23°C and the right side a temperature of 3°C. Time distance between each snapshot is indicated. The first appearance of dark NADH waves is marked by an arrow.
FIGURE 9
FIGURE 9
Velocity of the NADH waves along a temperature gradient. Each space coordinate at the abscissa corresponds to a different temperature between 23 and 3°C, as has been measured with an infrared camera. The data have been taken from the experiment shown in Fig. 8.

References

    1. Alcantara, F., and M. Monk. 1974. Signal propagation during aggregation in the slime mould Dictyostelium discoideum. J. Gen. Microbiol. 85:321–334. - PubMed
    1. Bergmeyer, H. U. 1974. Methods of Enzymatic Analysis, Vol. III. Verlag Chemie Weinheim/Academic Press, New York, NY and London, UK.
    1. Berridge, M. J., and P. E. Rapp. 1979. A comparative survey of the function, mechanism and control of cellular oscillations. J. Exp. Biol. 81:217–279. - PubMed
    1. Betz, A., and B. Chance. 1965. Influence of inhibitors and temperature on the oscillation of reduced pyridine nucleotides in yeast cells. Arch. Biochem. Biophys. 109:579–584. - PubMed
    1. Boiteux, A., A. Goldbeter, and B. Hess. 1975. Control of oscillating glycolysis of yeast by stochastic, periodic, and steady source of substrate: a model and experimental study. Proc. Natl. Acad. Sci. USA. 72:3829–3833. - PMC - PubMed

Publication types