. 2005 Jan;88(1):392-403.
doi: 10.1529/biophysj.104.040113. Epub 2004 Oct 15.

Interhelical spacing in liquid crystalline spermine and spermidine-DNA precipitates

Affiliations

Interhelical spacing in liquid crystalline spermine and spermidine-DNA precipitates

E Raspaud et al. Biophys J. 2005 Jan.

Abstract

The structure of polyamines-DNA precipitates was studied by x-ray diffraction. Precise measurements of the interhelix distance a(H) were obtained at different NaCl, polyamine, and DNA concentrations. Most of the results were obtained using spermine and few others using spermidine. The precipitates are liquid crystalline, either hexagonal and/or cholesteric, with an interhelical spacing that depends on the ionic concentrations and on the polyamine type. In our experimental conditions, the spacing varies from 28.15 to 33.4 angstroms. This variation is interpreted in terms of different ionic components that are present inside the precipitates and that are thought to regulate the value of the cohesive energy of DNA. These results are discussed in relation to the biological processes requiring a closeness of double helices and to the role played by polyamine analogs in cancer therapy.


Figures

FIGURE 1
FIGURE 1
Schematic representation of the phase diagram obtained in a previous study (Raspaud et al., 1988) for the precipitation of DNA fragments by spermine. The precipitation domain, where the dense precipitate separates from the dilute supernatant, is limited by the Cprecip and Credissol curves. In this representation, each experimental point is defined by the DNA concentration (CDNA phosphate) and the spermine salt concentration (Cspermine). Experimental points were located along five lines: (1a) CDNA = 0.03 mM; (1b) CDNA = 0.6 mM; (1c) CDNA = 3 mM; (2) CDNA = 90 mM; and (3) formula image at different monovalent salt concentrations. Two protocols were used to prepare the samples: 1), starting from spermine-DNA solution, water was added to dilute the sample, thus crossing the Credissol threshold, as indicated by the top arrow; and 2), starting from Na-DNA solutions, spermine was added to induce the precipitation by crossing the Cprecip threshold, as indicated by the bottom arrow. In Figs. 4–7, solid symbols refer to samples prepared from spermine-DNA (crossing the redissolution limit) and open symbols refer to samples prepared from Na-DNA (crossing the precipitation limit).
FIGURE 2
FIGURE 2
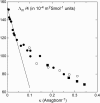
Molar conductivity of the spermine salt reduced by its valence (z = 4) as a function of the inverse of the Debye screening length κ. Measurements were done at 20–25°C. Spermine salt (with no DNA) was diluted in: distilled water (•),10 mM TE buffer (○), and 200 mM NaCl (▪). The contribution of the monovalent salts has been subtracted to display the molar conductivity of the spermine salt only. The straight line represents the variation predicted by the Debye-Hückel-Onsager theory in its limiting form when ions are fully dissociated.
FIGURE 3
FIGURE 3
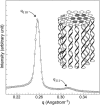
Typical diffraction spectrum of the dense DNA precipitate. The diffracted intensity profile has been obtained by radial integration. The first intense peak is due to the lateral hexagonal arrangement of the DNA chains in the plane perpendicular to the double-helix axis. The interaxial spacing aH between two neighboring DNA (insert) is determined from this peak position q110 via the equation aH = (2π / q110) × (2/√3). The second peak (q111) comes from a longitudinal order between the double helices. This profile was obtained from a spermine-DNA sample diluted in a 6 mM spermine salt solution.
FIGURE 4
FIGURE 4
Interhelix spacings measured in samples prepared with short DNA fragments (146 pb; ○,•). Some additional experiments were done with λ-DNA (⋄). Experiments were done in the low DNA concentration range (CDNA = 0.03 mM, 0.6 mM, and 3 mM). Spacings aH are presented in a semilogarithmic plot as a function of the spermine salt concentration and as a function of the Debye screening length κ−1 in the insert. Solid and open symbols refer to samples prepared from spermine-DNA and from Na-DNA, respectively.
FIGURE 5
FIGURE 5
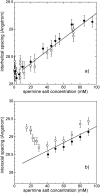
Variation of the interhelix spacing aH as a function of the spermine salt concentration for two DNA concentration ranges. Solid and open symbols refer to samples prepared from spermine-DNA and from Na-DNA, respectively. (a) In the low DNA concentration range (CDNA = 0.03 mM, 0.6 mM, and 3 mM; lines 1ac in Fig. 1), experimental points have been fitted by a linear relationship for spermine concentrations >10 mM. (b) In the high DNA concentration range (CDNA = 90 mM; line 2 in Fig. 1), data are compared to the linear fit given in panel a.
FIGURE 6
FIGURE 6
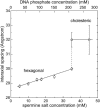
Interaxial spacing aH between short DNA fragments as a function of the spermine salt concentration (line 3 in Fig. 1). Samples were prepared by mixing the Na-DNA solution with the spermine salt solution, both being in 10 mM TE. For these samples, the ratio between the spermine salt concentration and the total DNA phosphate concentration, scaled on the upper x axis, is set to the constant value 1/6. The dashed line indicates the discontinuous transition between the hexagonal and the cholesteric phase.
FIGURE 7
FIGURE 7
Semilogarithmic representation of the interaxial spacing aH as a function of the spermine salt concentration in the low DNA concentration range (lines 1b and 1c in Fig. 1). Experiments were performed with short fragments, except the four points that correspond to long λ-DNA molecules, as indicated in the figure. The dilution of the spermine-DNA sample was performed in distilled water (•), 50 mM NaCl (▴), 100 mM NaCl (▾), and 200 mM NaCl (▪). At each salt concentration, the constant spacing is indicated by a horizontal line. The curve corresponds to Eq. 4. The dilution of the four Na-λ DNA samples was performed in 10 mM TE (○), 10 mM TE + 40 mM NaCl (▵), 10 mM TE + 90 mM NaCl (∇), and 10 mM TE + 190 mM NaCl (□).
FIGURE 8
FIGURE 8
Comparison of the experimental phase diagram determined for Na-DNA fragments in 10 mM TE buffer (open symbols) with the expected phase diagram for spermine-DNA fragments (dotted line) (double logarithmic plot).
FIGURE 9
FIGURE 9
Cohesive energy E per nucleotide, relative to the thermal energy kT, as a function of the interaxial spacing when DNA is condensed by spermine (•) or by spermidine (□) at different monovalent salt concentrations. The cohesive energy was estimated according to Eq. 5. The energies determined by Baumann et al. (2000) for spermidine (Δ), and by Rau and Parsegian (1992) for cobalthexamine (∇) are also plotted for comparison. The continuous curves are just guides for eyes whereas the dashed line illustrates the structural transition from a hexagonal to a cholesteric phase. All the data plotted here are given in Table 1.

Similar articles

Cited by

References

    1. Baeza, I., P. Gariglio, L. M. Rangel, P. Chavez, L. Cervantes, C. Arguello, C. Wong, and C. Montanez. 1987. Electron microscopy and biochemical properties of polyamine-compacted DNA. Biochemistry. 26:6387–6392. - PubMed
    1. Baumann, C., V. A. Bloomfield, S. B. Smith, C. Bustamante, M. D. Wang, and S. M. Block. 2000. Stretching of single collapsed DNA molecules. Biophys. J. 78:1965–1978. - PMC - PubMed
    1. Becker, M., R. Misselwitz, H. Damaschun, G. Damaschun, and D. Zirwer. 1979. Spermine-DNA complexes build up metastable structures. Small-angle X-ray scattering and circular dichroism studies. Nucleic Acids Res. 7:1297–1309. - PMC - PubMed
    1. Behe, M., and G. Felsenfeld. 1981. Effects of methylation on a synthetic polynucleotide: the B-Z transition in poly(dG-m5dC).poly(dG-m5dC). Proc. Natl. Acad. Sci. USA. 78:1619–1623. - PMC - PubMed
    1. Bloomfield, V. A. 1996. DNA condensation. Curr. Opin. Struct. Biol. 6:334–341. - PubMed

Publication types

MeSH terms

LinkOut - more resources