. 2004 Nov;186(21):7032-68.
doi: 10.1128/JB.186.21.7032-7068.2004.

Genome of bacteriophage P1

Affiliations

Genome of bacteriophage P1

Małgorzata B Łobocka et al. J Bacteriol. 2004 Nov.

Abstract

P1 is a bacteriophage of Escherichia coli and other enteric bacteria. It lysogenizes its hosts as a circular, low-copy-number plasmid. We have determined the complete nucleotide sequences of two strains of a P1 thermoinducible mutant, P1 c1-100. The P1 genome (93,601 bp) contains at least 117 genes, of which almost two-thirds had not been sequenced previously and 49 have no homologs in other organisms. Protein-coding genes occupy 92% of the genome and are organized in 45 operons, of which four are decisive for the choice between lysis and lysogeny. Four others ensure plasmid maintenance. The majority of the remaining 37 operons are involved in lytic development. Seventeen operons are transcribed from sigma(70) promoters directly controlled by the master phage repressor C1. Late operons are transcribed from promoters recognized by the E. coli RNA polymerase holoenzyme in the presence of the Lpa protein, the product of a C1-controlled P1 gene. Three species of P1-encoded tRNAs provide differential controls of translation, and a P1-encoded DNA methyltransferase with putative bifunctionality influences transcription, replication, and DNA packaging. The genome is particularly rich in Chi recombinogenic sites. The base content and distribution in P1 DNA indicate that replication of P1 from its plasmid origin had more impact on the base compositional asymmetries of the P1 genome than replication from the lytic origin of replication.


Figures
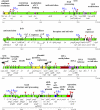
FIG. 1.
FIG. 1.
Genetic and physical organization of the P1 genome. Boxes with internal triangles show positions and orientations of genes, color-coded by function: yellow, plasmid maintenance; red, repression of early functions; pink, immunity control, not c1 itself; magenta, source of tRNAs; brown, DNA methylation; deep blue, transcriptional activation of late genes; grey, defective IS1; green, all other. Black boxes are intergenic regions of defined function: recombination sites, iterons to which RepA binds, plasmid centromere, and origin of DNA packaging, the direction of packaging being indicated by an arrowhead at the pac site. Bidirectional replication determined at the phage (lytic) origin, oriL, and at the plasmid origin, oriR, are indicated by black arrowheads above the genome map. C1 operator sites are marked with red flags pointing to the left or right (see also Table 6). Thin lines with terminal deep blue half arrowheads indicate the start sites and directions of the transcripts from particular late promoters. GATC sequences that overlap transcriptional promoters and clustered 5′-GATC sequences (two or more sites with pairwise separation of not more than 50 bp), substrates for Dmt or Dam methylation, are marked above the gene map by brown lollipops that are filled in the case of sites shown to alter function upon methylation. Hooks indicate Rho-independent transcriptional terminators. They face the starts of transcripts that they terminate. The map refers to the genome of P1 c1-100 mod749::IS5 without its nonintegral part, IS5.
FIG. 2.
FIG. 2.
Compositional organization of the P1 genome. The G+C content and (C−G)/(C+G) ratio (C-G skew) for one strand of P1 DNA are plotted as deviations from the mean. The plots were made with the GeneQuest program of DNAStar with a window size of 1,000 bp and a shift increment of 1 bp. For orientation, a simplified genome map is shown centrally. Upper-row genes are transcribed clockwise (left to right), and lower-row genes are transcribed counterclockwise (right to left). Two vertical black lines through the plots show the locations of the lytic (oriL) and plasmid (oriR) origins of replication. Two vertical grey bars show regions of polarity switch in the plot of the C-G skew. Unique recognition sites for restriction enzymes are indicated directly above the plot of G+C content; those below the line are for 8-bp cutters. See the text for absent 6-bp restriction sites. Chi sites and RAG sites (64) in the upper and lower strands are indicated by hash marks above and below the horizontal lines at the top of the figure. Where two hash marks are so close as to appear superimposed, a line at an angle to the vertical is added. The map refers to the genome of P1 c1-100 mod749::IS5 without its nonintegral parts, IS5, and the associated 4-bp duplication.
FIG. 3.
FIG. 3.
P1-encoded tRNAs and codons presumably recognized by them. The identity determinants of tRNAs are marked by asterisks. The putative modification of tRNA3 by lysinylation at the 2 position of cytosine alters the recognition specificity of the anticodon. The bar graphs compare the usage frequencies of codons recognized by P1 tRNAs in protein-coding genes of P1 (black bars) and E. coli K-12 (grey bars) per 1,000 codons. The usage frequency of a particular codon in P1 is its relative abundance among codons in genes that encode proteins. The usage frequency of a particular codon in E. coli K-12 is according to the March 2004 edition of the Codon Usage Database found at its website (http://www.kazusa.or.jp/codon/).
FIG. 4.
FIG. 4.
Alignment of alternative tail fiber proteins and protein segments.
FIG. 5.
FIG. 5.
Conserved sequence motifs in the predicted amino acid sequences of the N-terminal domain of DarB and of selected γ-type DNA N6-adenine methyltransferases. The motifs are indicated by Roman numerals according to reference . Methylated nucleotides in target sequences of DarB homologs are underlined (32, 159, 162, 167, 340).
FIG. 6.
FIG. 6.
Known and putative holins encoded by P1. (Top) Alignment of the amino acid sequences of the LydA holin and the putative holin, LydC. Two putative transmembrane helices (TMH) are highlighted in grey. (Bottom) The amino acid sequence of the predicted holin LydD. Putative transmembrane helices are highlighted.

Comment in

Similar articles

Cited by

References

    1. Abeles, A., T. Brendler, and S. Austin. 1993. Evidence of two levels of control of P1 oriR and host oriC replication origins by DNA adenine methylation. J. Bacteriol. 175:7801-7807. - PMC - PubMed
    1. Abeles, A. L. 1986. P1 plasmid replication. Purification and DNA-binding activity of the replication protein RepA. J. Biol. Chem. 261:3548-3555. - PubMed
    1. Abeles, A. L., and S. J. Austin. 1991. Antiparallel plasmid-plasmid pairing may control P1 plasmid replication. Proc. Natl. Acad. Sci. USA 88:9011-9015. - PMC - PubMed
    1. Abeles, A. L., S. A. Friedman, and S. J. Austin. 1985. Partition of unit-copy miniplasmids to daughter cells. III. The DNA sequence and functional organization of the P1 partition region. J. Mol. Biol. 185:261-272. - PubMed
    1. Abeles, A. L., L. D. Reaves, and S. J. Austin. 1989. Protein-DNA interactions in regulation of P1 plasmid replication. J. Bacteriol. 171:43-52. - PMC - PubMed

Publication types

Associated data

LinkOut - more resources