

Incremental nature of anterior eye grading scales determined by objective image analysis
- PMID: 15489489
- PMCID: PMC1772388
- DOI: 10.1136/bjo.2004.045534
Incremental nature of anterior eye grading scales determined by objective image analysis
Abstract
Aim: To use previously validated image analysis techniques to determine the incremental nature of printed subjective anterior eye grading scales.
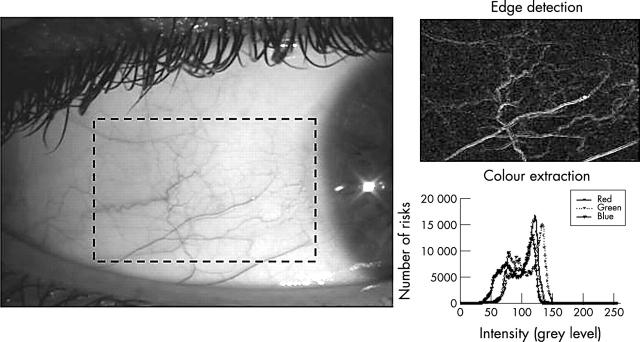
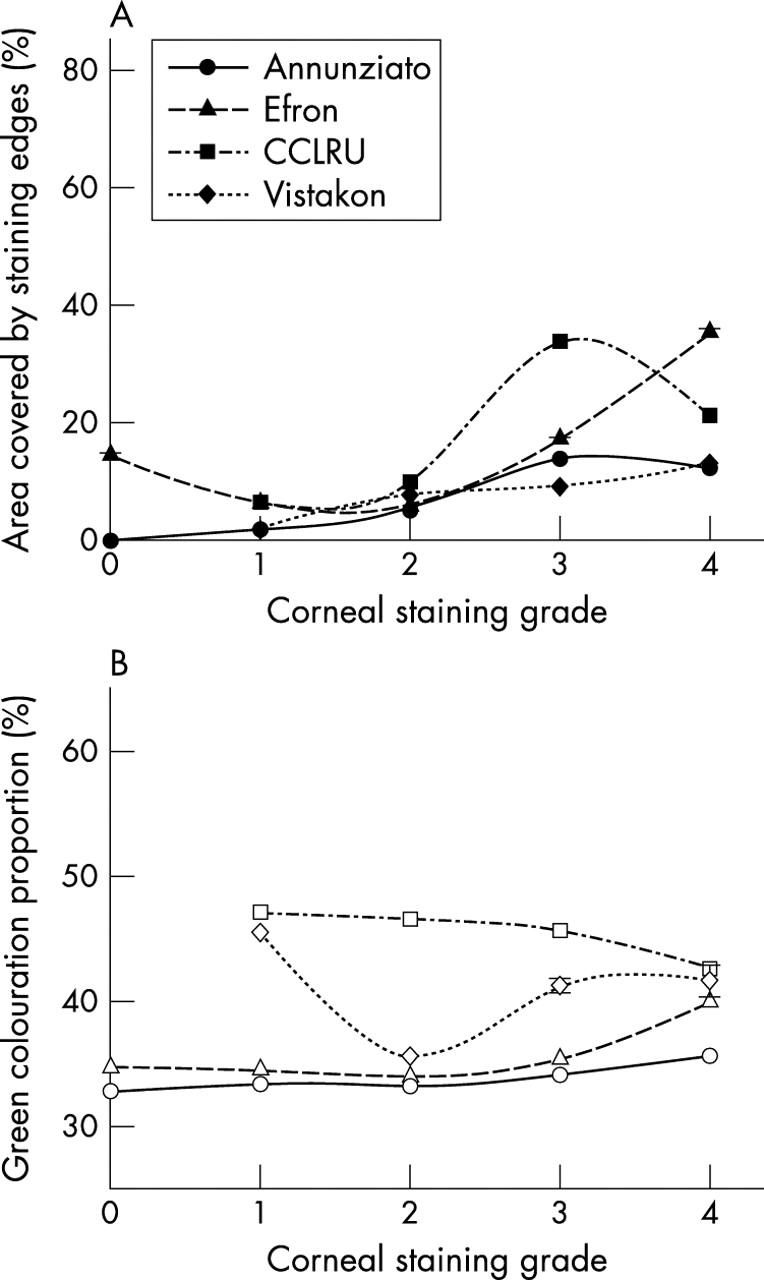
Methods: A purpose designed computer program was written to detect edges using a 3 x 3 kernal and to extract colour planes in the selected area of an image. Annunziato and Efron pictorial, and CCLRU and Vistakon-Synoptik photographic grades of bulbar hyperaemia, palpebral hyperaemia roughness, and corneal staining were analysed.
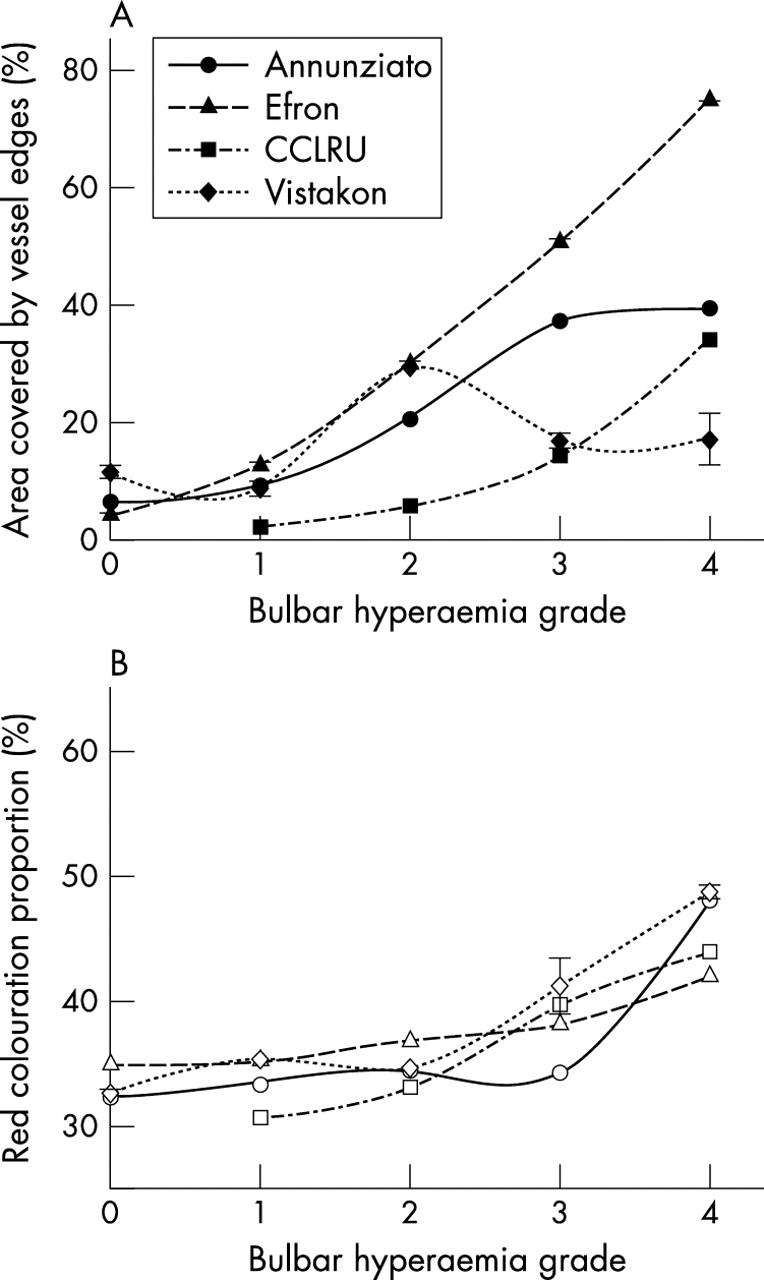
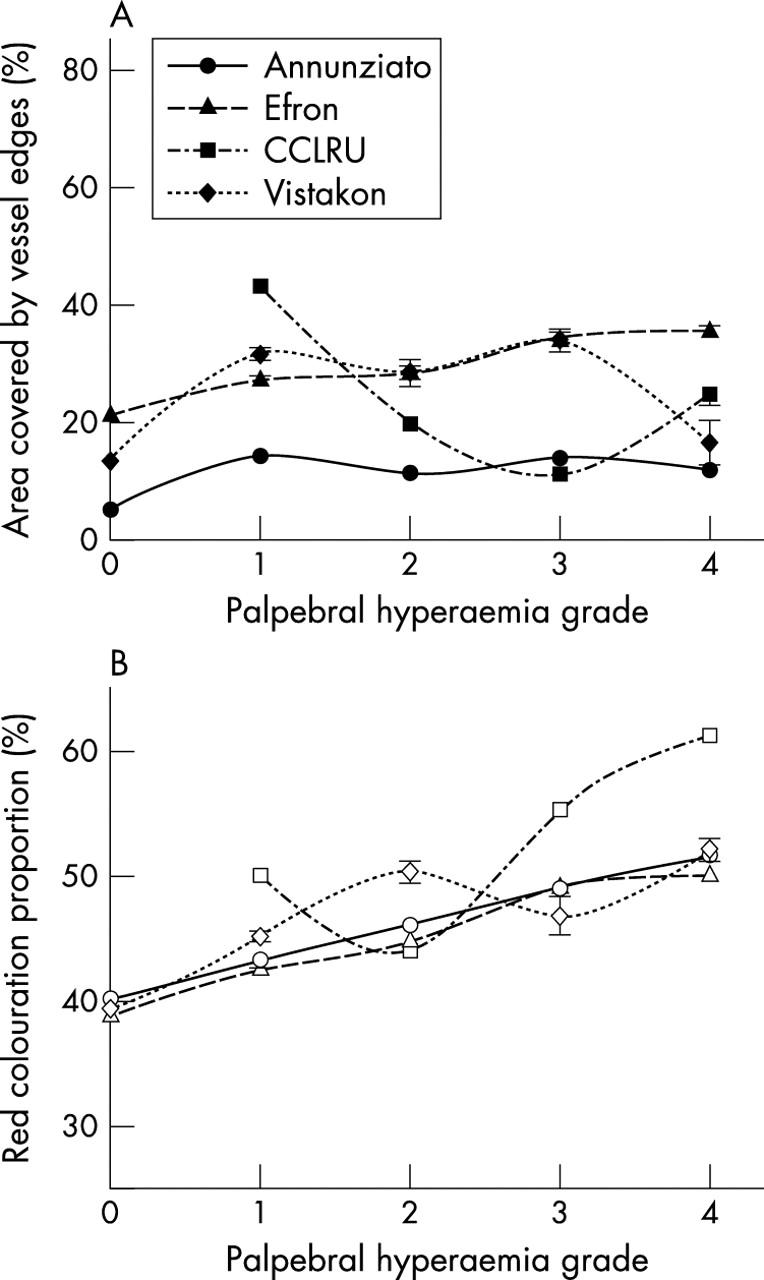
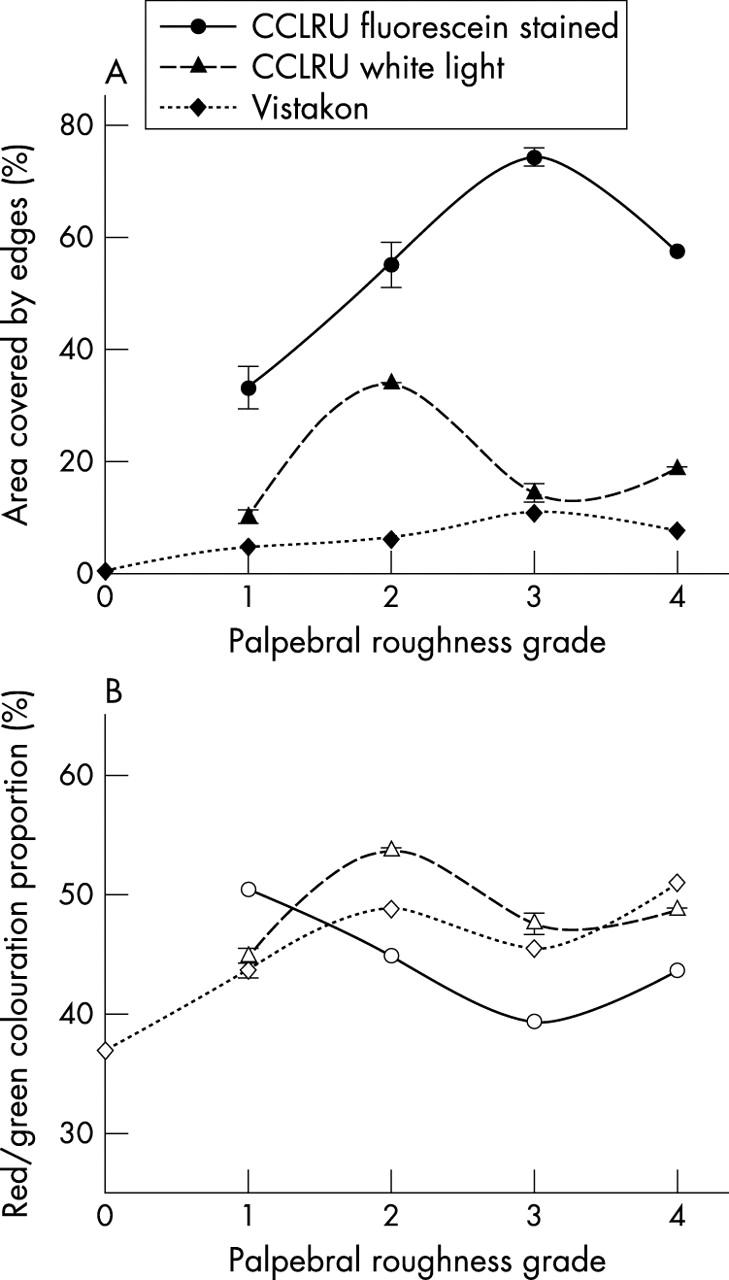
Results: The increments of the grading scales were best described by a quadratic rather than a linear function. Edge detection and colour extraction image analysis for bulbar hyperaemia (r2 = 0.35-0.99), palpebral hyperaemia (r2 = 0.71-0.99), palpebral roughness (r2 = 0.30-0.94), and corneal staining (r2 = 0.57-0.99) correlated well with scale grades, although the increments varied in magnitude and direction between different scales. Repeated image analysis measures had a 95% confidence interval of between 0.02 (colour extraction) and 0.10 (edge detection) scale units (on a 0-4 scale).
Conclusion: The printed grading scales were more sensitive for grading features of low severity, but grades were not comparable between grading scales. Palpebral hyperaemia and staining grading is complicated by the variable presentations possible. Image analysis techniques are 6-35 times more repeatable than subjective grading, with a sensitivity of 1.2-2.8% of the scale.
Figures
References
-
- Mandell RB. Slit lamp classification system. J Am Optom Assoc 1987;58:198–201. - PubMed
-
- Woods R . Quantitative slit lamp observations in contact lens practice. J Br Contact Lens Assoc 1989; Scientific Meeting :42–5.
-
- Efron N . Grading scales for contact lens complications. Ophthal Physiol Opt 1998;18:182–6. - PubMed
-
- Andersen JS, Davies IP, Kruse A, et al. Handbook of Contact Lens Management. Jacksonville, Florida, USA: Vistakon, 1996.
-
- McMonnies CW, Chapman-Davies A. Assessment of conjunctival hyperaemia in contact lens wearers. Part 1. Am J Optom Physiol Opt 1987;64:246–50. - PubMed